Chl a μg/L
TP mg/L
or select a name below to show just that site in Google Earth)
Chl a
TP
all
chem
disk
oC
mg/L
| № | Median Chl a μg/L |
n | Median TP mg/L | n |
Name (click here to see all sites in Google Earth or select a name below to show just that site in Google Earth) |
Plot Chl a TP |
Plot all chem |
Secchi disk |
T oC |
O2 mg/L |
|---|---|---|---|---|---|---|---|---|---|---|
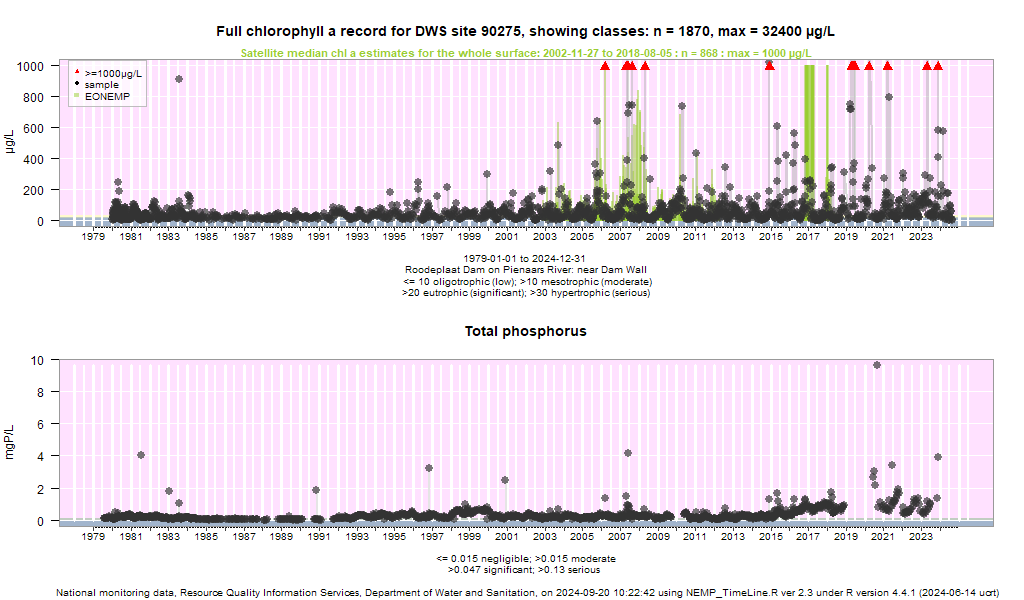
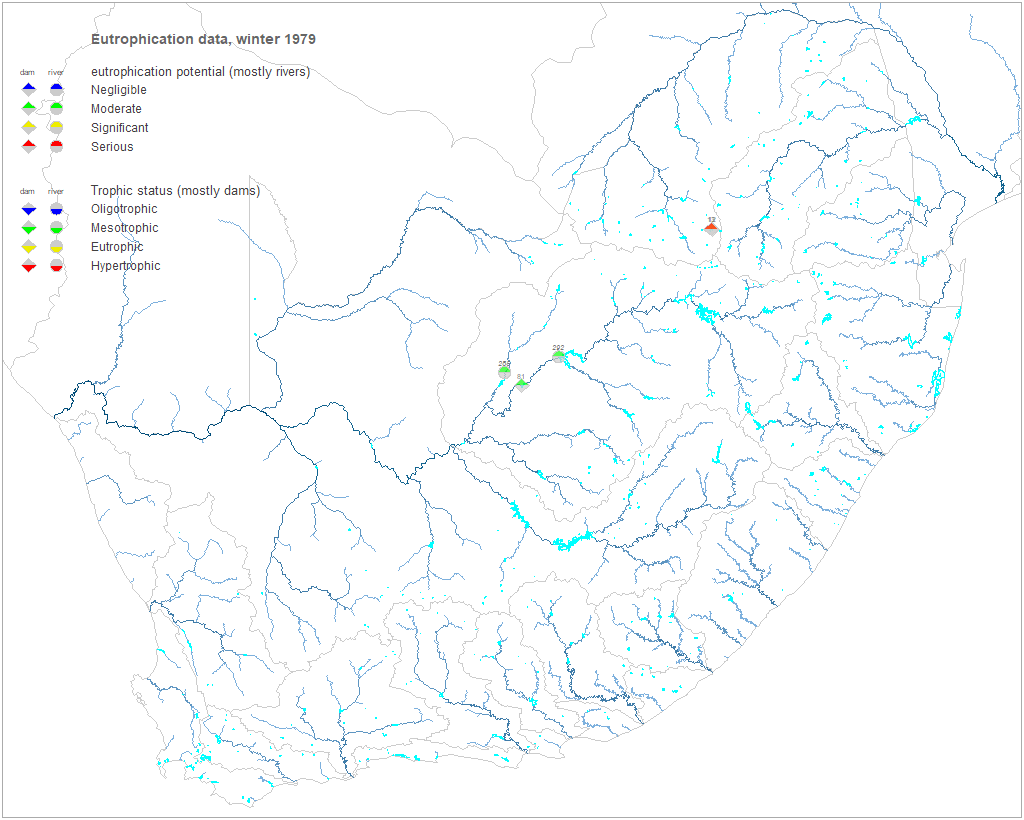
| 12 | 0.123 | 6 | Roodeplaat Dam on Pienaars River: near Dam Wall |
| chem | Secchi | T | O | ||
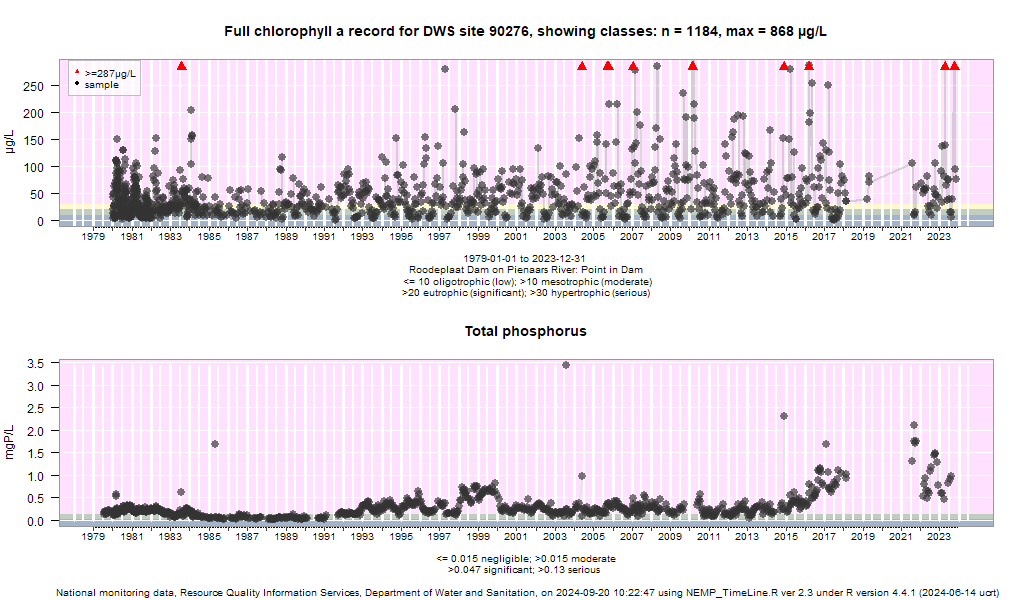
| 13 | 0.156 | 6 | Roodeplaat Dam on Pienaars River: Point in Dam |
| chem | Secchi | T | O | ||
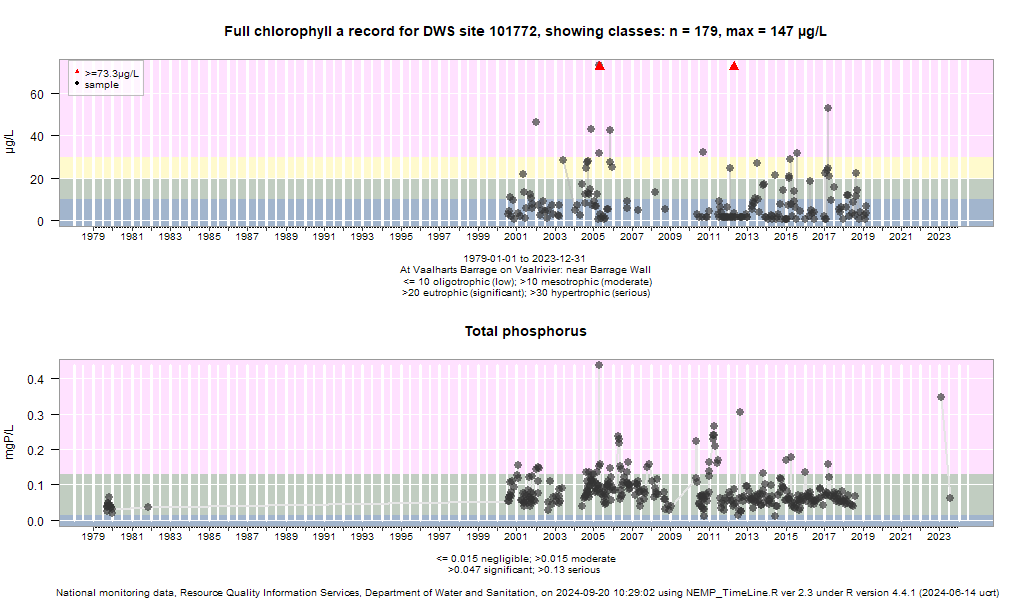
| 81 | 0.035 | 3 | At Vaalharts Barrage on Vaalrivier: near Barrage Wall |
| chem | Secchi | T | - | ||
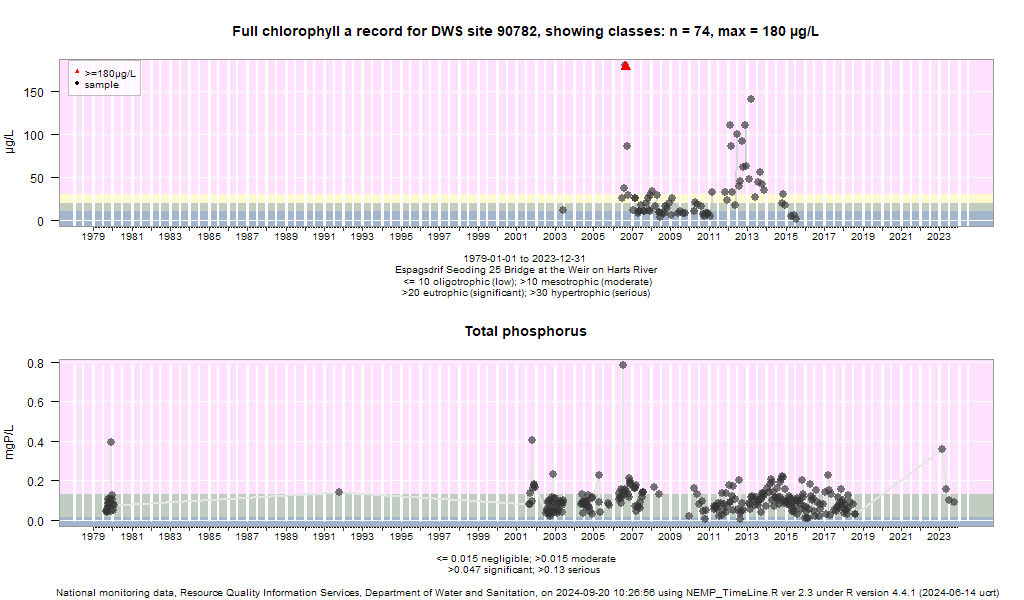
| 285 | 0.046 | 4 | Espagsdrif Seoding 25 Bridge at the Weir on Harts River |
| chem | - | - | - | ||
| 292 | 0.037 | 5 | Bloemhof Dam on Vaal River: Down Stream Weir | 90908 no chart | chem | - | - | - |