Chl a μg/L
TP mg/L
or select a name below to show just that site in Google Earth)
Chl a
TP
all
chem
disk
oC
mg/L
| № | Median Chl a μg/L |
n | Median TP mg/L | n |
Name (click here to see all sites in Google Earth or select a name below to show just that site in Google Earth) |
Plot Chl a TP |
Plot all chem |
Secchi disk |
T oC |
O2 mg/L |
|---|---|---|---|---|---|---|---|---|---|---|
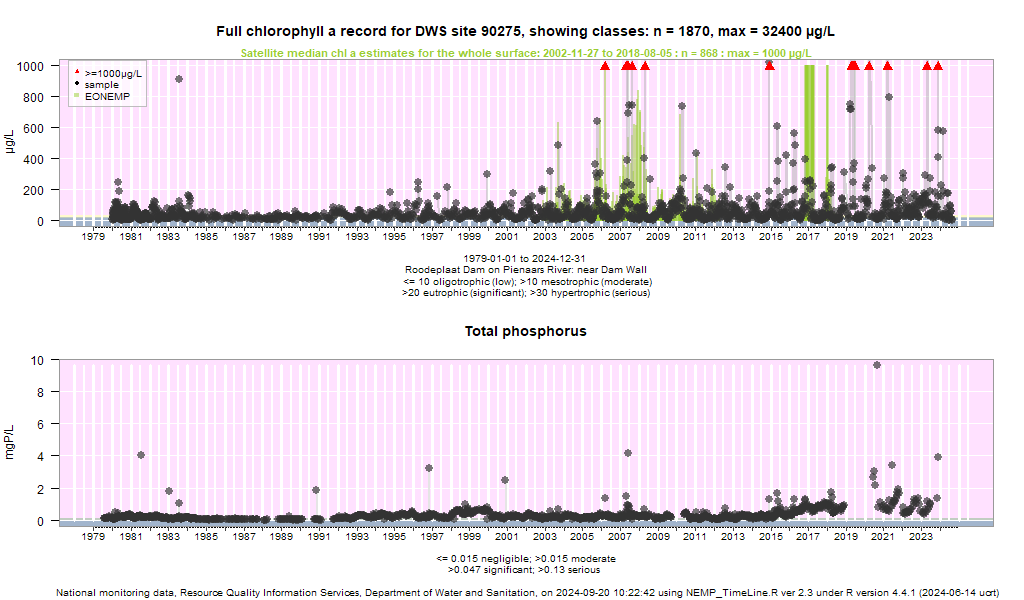
| 12 | 88.0 | 29 | Roodeplaat Dam on Pienaars River: near Dam Wall |
| chem | Secchi | T | O | ||
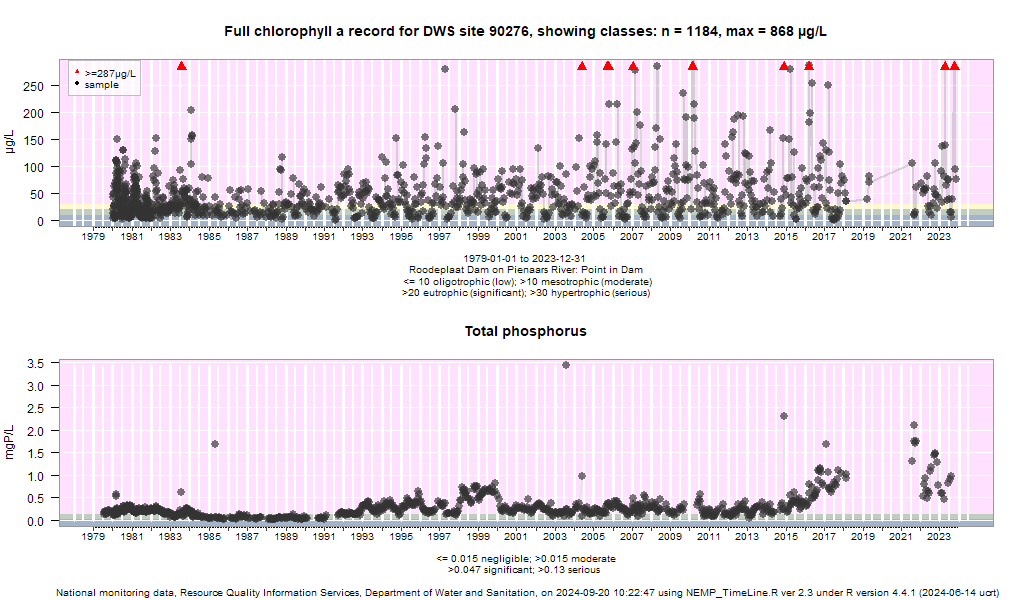
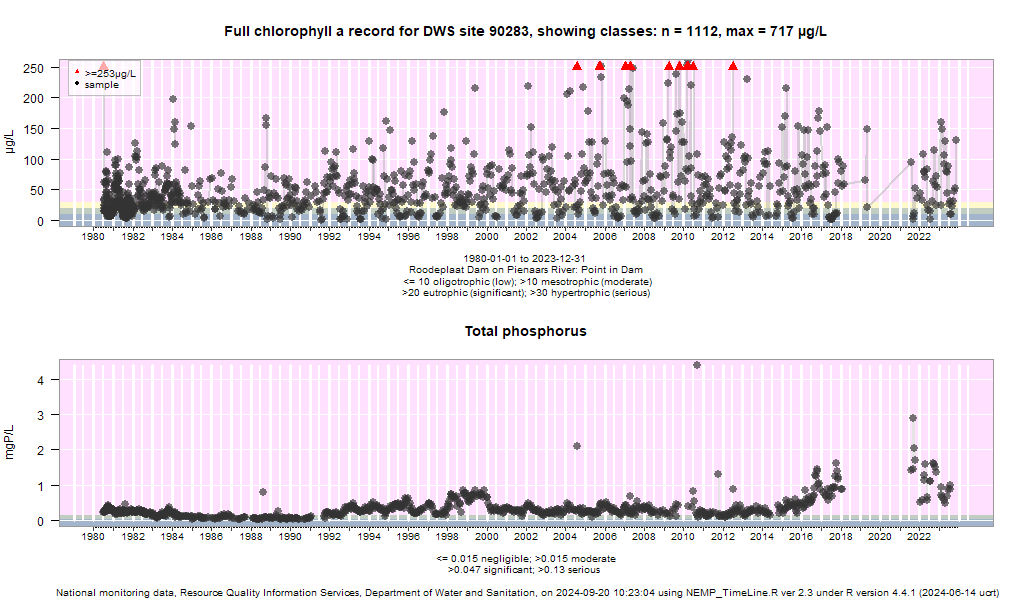
| 13 | 69.8 | 3 | Roodeplaat Dam on Pienaars River: Point in Dam |
| chem | Secchi | T | O | ||
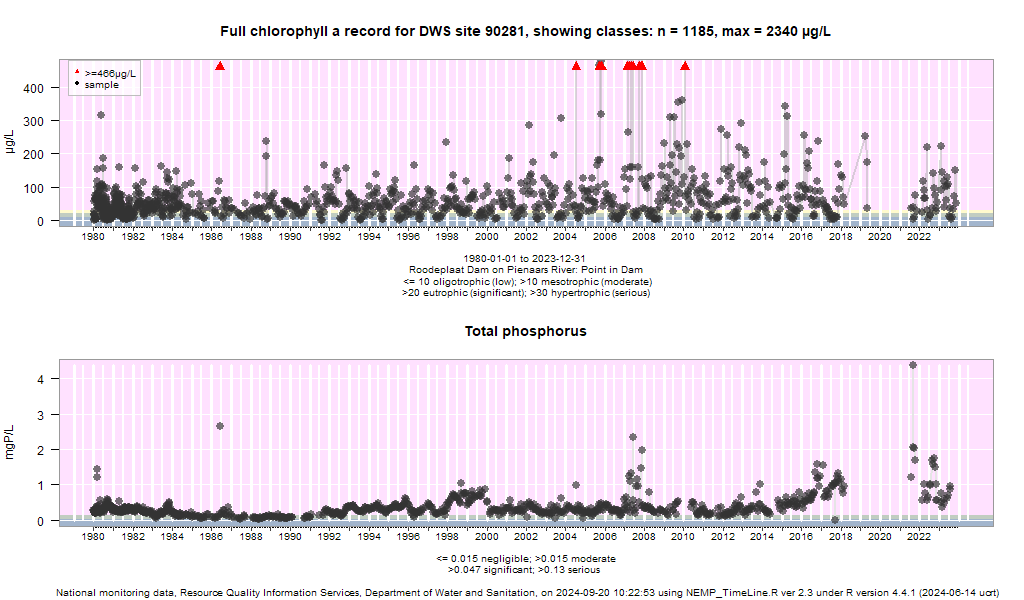
| 14 | 174.5 | 3 | Roodeplaat Dam on Pienaars River: Point in Dam |
| chem | Secchi | T | O | ||
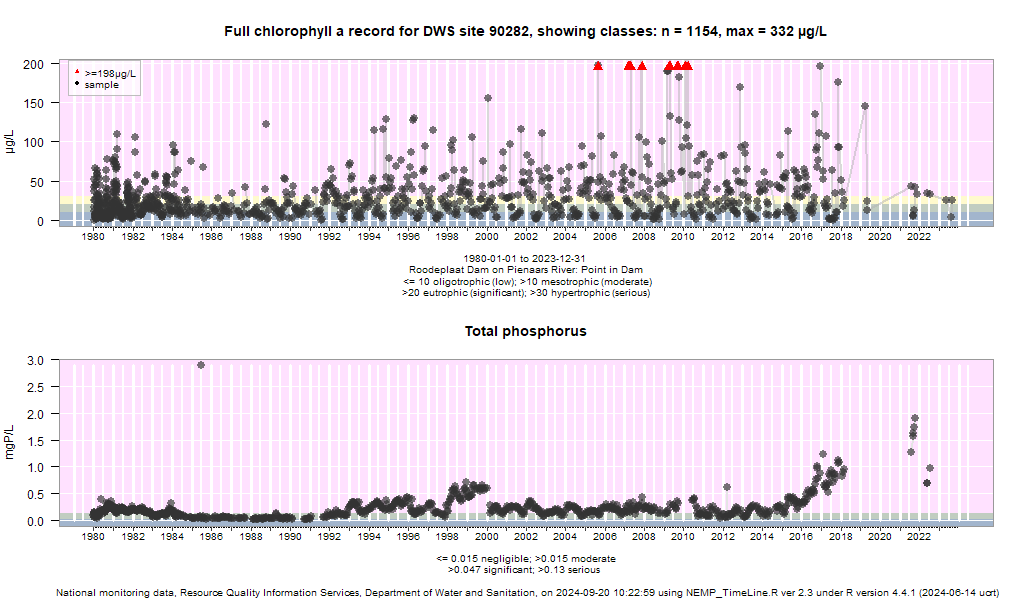
| 15 | 24.6 | 3 | Roodeplaat Dam on Pienaars River: Point in Dam |
| chem | Secchi | T | O | ||
| 16 | 65.7 | 3 | Roodeplaat Dam on Pienaars River: Point in Dam |
| chem | Secchi | T | O | ||
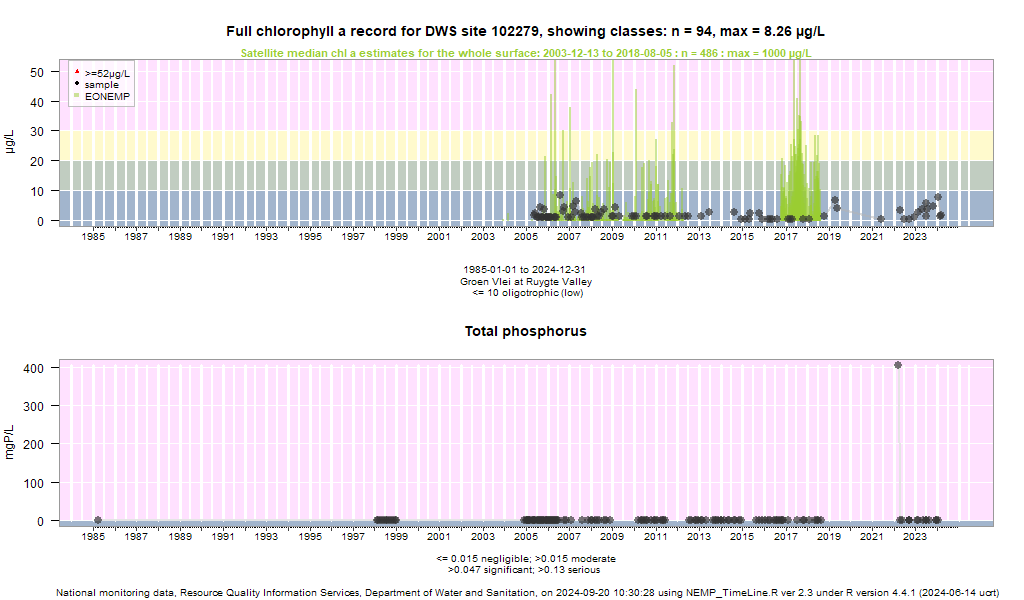
| 104 | 5.5 | 2 | Groen Vlei at Ruygte Valley |
| chem | Secchi | T | - |