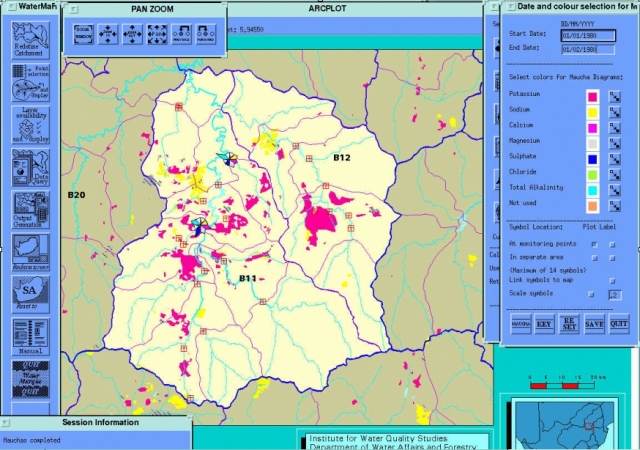
 Snapshots of the geographical distribution of salinity components
for 1980 (above) and 1986 (right) provide further insight into the problem.
We note also that monitoring has become more intensive in recent times.
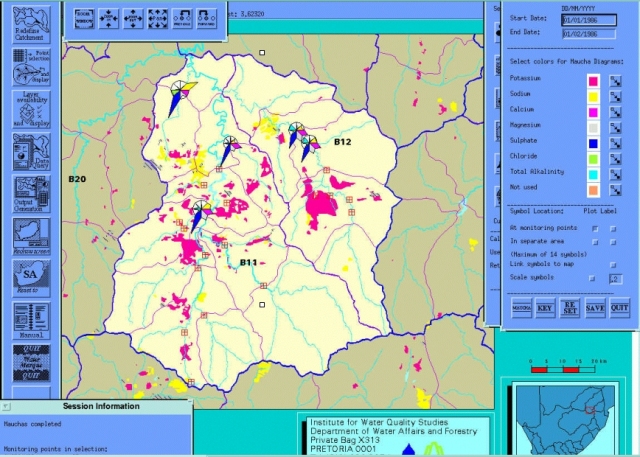
Snapshots of the geographical distribution of salinity components
for 1980 (above) and 1986 (right) provide further insight into the problem.
We note also that monitoring has become more intensive in recent times.
(We do not yet have time series for land cover change -- these images all show the situation in about 1994.)
Please send comments on these pages to Michael Silberbauer at the Institute for Water Quality Studies.
[ Back to Index Page ]