| № |
Site
[
view Gouritz sites in Google Earth
]
|
Plot all data |
Date |
MPN, or cfu / 100mL
|
Turb.
NTU |
pH |
Temp.
oC |
Risk based on E. coli if recorded, otherwise on faecal coliforms |
| E. coli |
faecal coliforms |
drinking-
no treatment |
drinking-
limited treatment |
full or
partial
contact |
irrigation-
crops eaten raw |
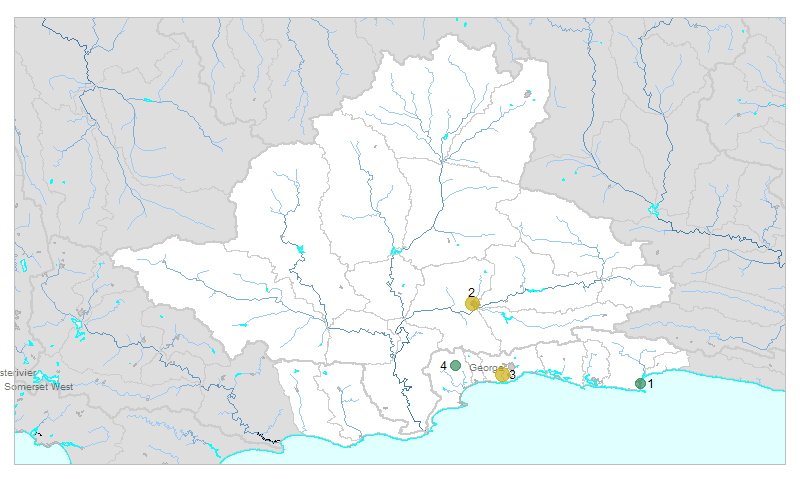
| 1 | 102305 [2-month plot]
Piesang River (Mouth) at Plettenbergbaai |

|
2008-03-04 |
2419 |
- |
- |
7.0 |
- |
HIGH |
Med |
HIGH |
Med |
| 1 | 102305 | |
2008-03-18 |
261 |
- |
- |
6.5 |
- |
HIGH |
low |
Med |
low |
| 1 | 102305 | |
2008-04-01 |
179 |
- |
- |
7.0 |
- |
HIGH |
low |
low |
low |
| 1 | 102305 | |
2008-04-22 |
94 |
- |
- |
8.0 |
- |
HIGH |
low |
low |
low |
| 2 | 189533 [2-month plot]
Oudtshoorn at Low Water Bridge Next to ATKV Theater on Grobbelaars |

|
2008-03-04 |
2419 |
- |
- |
7.0 |
- |
HIGH |
Med |
HIGH |
Med |
| 2 | 189533 | |
2008-04-01 |
7701 |
- |
- |
7.0 |
- |
HIGH |
Med |
HIGH |
HIGH |
| 2 | 189533 | |
2008-04-21 |
980 |
- |
- |
8.0 |
- |
HIGH |
low |
HIGH |
low |
| 3 | 189534 [2-month plot]
- Gwayang D/S of STW at Causeway on Gwaingrivier |

|
2008-03-03 |
830 |
- |
- |
8.0 |
- |
HIGH |
low |
HIGH |
low |
| 3 | 189534 | |
2008-03-17 |
613 |
- |
- |
7.0 |
- |
HIGH |
low |
HIGH |
low |
| 3 | 189534 | |
2008-04-16 |
326 |
- |
- |
7.0 |
- |
HIGH |
low |
Med |
low |
| 3 | 189534 | |
2008-04-21 |
1046 |
- |
- |
6.0 |
- |
HIGH |
low |
HIGH |
Med |
| 4 | 189536 [2-month plot]
Leeukloof at Low Water Bridge on Paardekoprivier |

|
2008-04-21 |
308 |
- |
- |
5.0 |
- |
HIGH |
low |
Med |
low |


