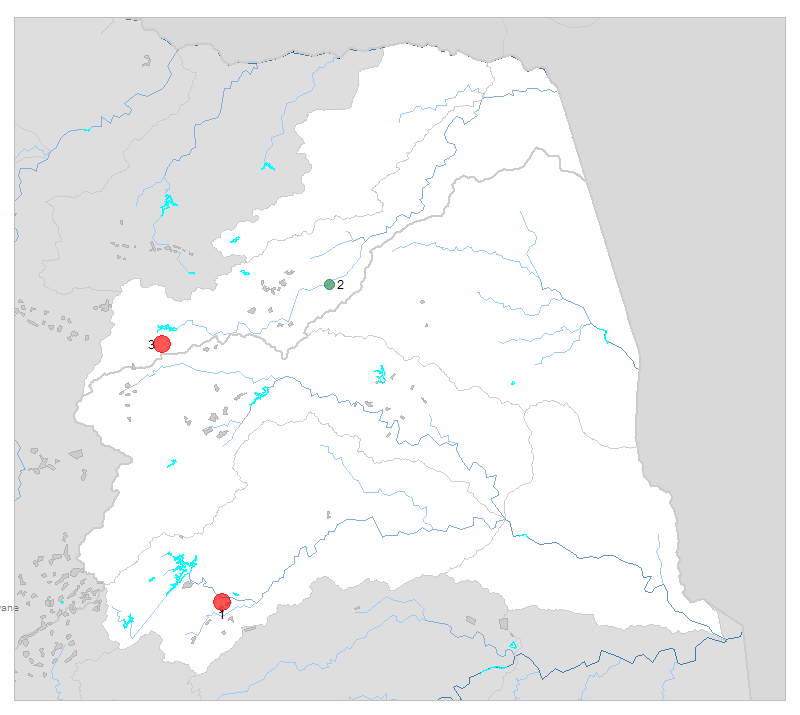
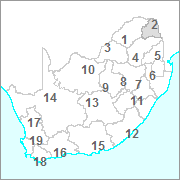
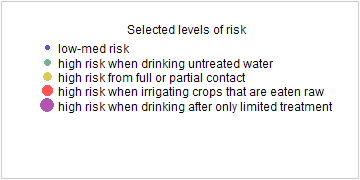
| № |
Site
[
view Luvuvhu and Letaba sites in Google Earth
]
|
Plot all data |
Date |
MPN, or cfu / 100mL
|
Turb.
NTU |
pH |
Temp.
oC |
Risk based on E. coli if recorded, otherwise on faecal coliforms |
| E. coli |
faecal coliforms |
drinking-
no treatment |
drinking-
limited treatment |
full or
partial
contact |
irrigation-
crops eaten raw |
| 1 | 187106 [2-month plot]
Letaba 6 Nkowankowa Industrial Area upstream of Maribe River |

|
2020-10-05 |
6930 |
- |
- |
7.4 |
- |
HIGH |
Med |
HIGH |
HIGH |
| 2 | 190136 [2-month plot]
Nandoni Dam downstream of Dam Weir on Luvuvhu River |

|
2020-10-07 |
27 |
- |
- |
7.6 |
- |
HIGH |
low |
low |
low |
| 3 | 1000005469 [2-month plot]
Mudzwiriti River downstream of Waterval S/W - Check Position |

|
2020-10-08 |
4880 |
- |
- |
7.4 |
- |
HIGH |
Med |
HIGH |
HIGH |


