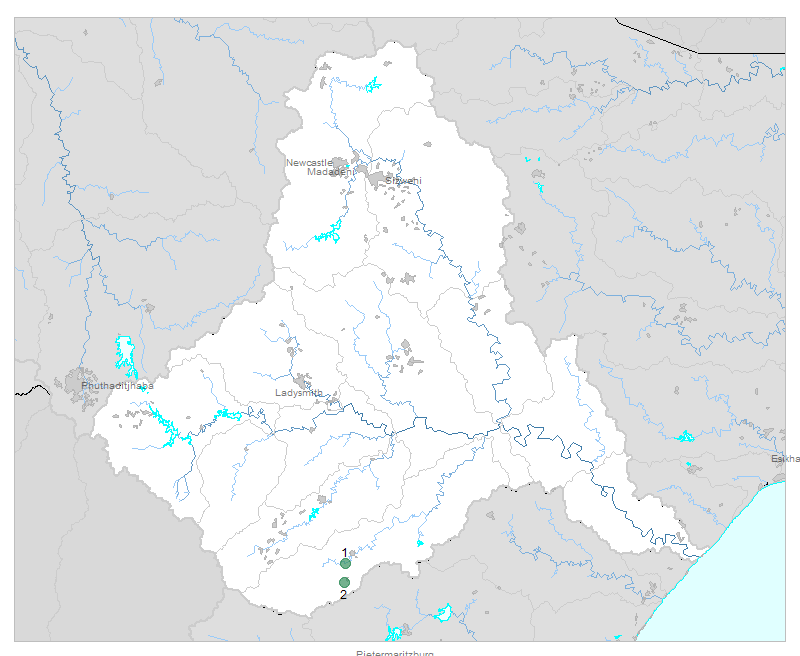
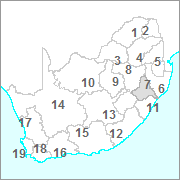
[ view Thukela sites in Google Earth ]
NTU
oC
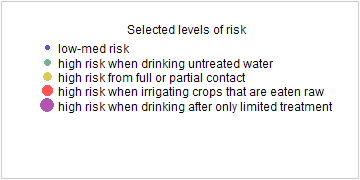
no treatment
limited treatment
partial
contact
crops eaten raw
Mearns Dam- Mearns Main Basin Integrated

Spring Grove Dam- Spring Grove Main Basin Integrated

| № | Site [ view Thukela sites in Google Earth ] |
Plot all data | Date | MPN, or cfu / 100mL |
Turb. NTU |
pH | Temp. oC |
Risk based on E. coli if recorded, otherwise on faecal coliforms | ||||
|---|---|---|---|---|---|---|---|---|---|---|---|---|
| E. coli | faecal coliforms | drinking- no treatment |
drinking- limited treatment |
full or partial contact |
irrigation- crops eaten raw |
|||||||
| 1 | 195009 [2-month plot]
Mearns Dam- Mearns Main Basin Integrated |

|
2017-01-10 | 112 | - | 7 | 7.6 | - | HIGH | low | low | low |
| 1 | 195009 | 2017-01-24 | 65 | - | 6 | 7.6 | - | HIGH | low | low | low | |
| 1 | 195009 | 2017-02-07 | 387 | - | 3 | 7.3 | - | HIGH | low | Med | low | |
| 1 | 195009 | 2017-02-21 | 2143 | - | 22 | 7.5 | - | HIGH | Med | HIGH | Med | |
| 2 | 195010 [2-month plot]
Spring Grove Dam- Spring Grove Main Basin Integrated |

|
2017-01-06 | 30 | - | 1 | 7.8 | - | HIGH | low | low | low |
| 2 | 195010 | 2017-01-20 | 6 | - | 1 | - | - | Med | low | low | low | |
| 2 | 195010 | 2017-02-03 | 12 | - | 2 | 7.5 | - | HIGH | low | low | low | |
| 2 | 195010 | 2017-02-17 | 10 | - | 2 | - | - | HIGH | low | low | low | |

 |
 |