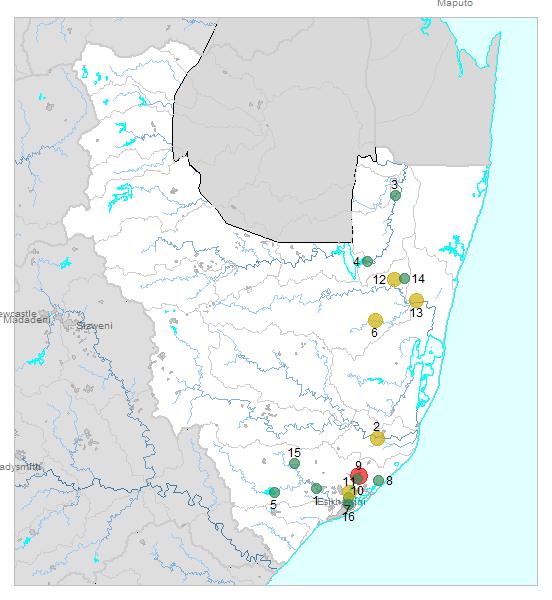
| № |
Site
[
view Usutu to Mhlatuze sites in Google Earth
]
|
Plot all data |
Date |
MPN, or cfu / 100mL
|
Turb.
NTU |
pH |
Temp.
oC |
Risk based on E. coli if recorded, otherwise on faecal coliforms |
| E. coli |
faecal coliforms |
drinking-
no treatment |
drinking-
limited treatment |
full or
partial
contact |
irrigation-
crops eaten raw |
| 1 | 102809 [2-month plot]
Mhlatuze River at Riverview 11459 |

|
2017-03-01 |
350 |
- |
49 |
7.7 |
30.6 |
HIGH |
low |
Med |
low |
| 1 | 102809 | |
2017-03-13 |
441 |
- |
28 |
7.4 |
28.5 |
HIGH |
low |
HIGH |
low |
| 2 | 102839 [2-month plot]
Mfolozi River at Reserve no 5/Gwa-Msane |

|
2017-03-01 |
960 |
- |
908 |
7.5 |
30.1 |
HIGH |
low |
HIGH |
low |
| 2 | 102839 | |
2017-03-13 |
1223 |
- |
26 |
7.7 |
25.9 |
HIGH |
low |
HIGH |
Med |
| 3 | 102902 [2-month plot]
At Lake View Ndumu Kangazini on Pongolo |

|
2017-03-06 |
30 |
- |
110 |
8.2 |
28.6 |
HIGH |
low |
low |
low |
| 3 | 102902 | |
2017-03-20 |
20 |
- |
16 |
8.2 |
23.4 |
HIGH |
low |
low |
low |
| 4 | 102905 [2-month plot]
Pongolapoort Dam on Phongolo River: downstream Weir |

|
2017-03-06 |
74 |
- |
9 |
7.9 |
29.8 |
HIGH |
low |
low |
low |
| 4 | 102905 | |
2017-03-20 |
122 |
- |
8 |
8.2 |
23.4 |
HIGH |
low |
low |
low |
| 5 | 103330 [2-month plot]
Normanhurst 3023 - Goedertrou Dam on Mhlatuze River: at Dam Wall |

|
2017-03-01 |
74 |
- |
434 |
- |
29.0 |
HIGH |
low |
low |
low |
| 6 | 172387 [2-month plot]
Umsinduzi |

|
2017-03-01 |
512 |
- |
41 |
8.0 |
29.6 |
HIGH |
low |
HIGH |
low |
| 7 | 177769 [2-month plot]
Mhlatuze River at Umhlatuze Valley |

|
2017-03-13 |
211 |
- |
26 |
7.4 |
26.1 |
HIGH |
low |
Med |
low |
| 8 | 183757 [2-month plot]
Mdibi River at Bridge to RBM |

|
2017-03-01 |
20 |
- |
12 |
4.2 |
26.7 |
HIGH |
low |
low |
low |
| 8 | 183757 | |
2017-03-14 |
465 |
- |
15 |
4.3 |
23.6 |
HIGH |
low |
HIGH |
low |
| 9 | 183761 [2-month plot]
Mposa River Under Bridge |

|
2017-03-01 |
209 |
- |
19 |
7.7 |
28.5 |
HIGH |
low |
Med |
low |
| 9 | 183761 | |
2017-03-13 |
24196 |
- |
24 |
7.6 |
23.6 |
HIGH |
HIGH |
HIGH |
HIGH |
| 10 | 187078 [2-month plot]
Between N2 Bridge and Mposa Confluence on Nseleni |

|
2017-03-01 |
279 |
- |
127 |
7.8 |
28.6 |
HIGH |
low |
Med |
low |
| 10 | 187078 | |
2017-03-13 |
85 |
- |
26 |
7.3 |
25.5 |
HIGH |
low |
low |
low |
| 11 | 187079 [2-month plot]
At Road Bridge downstream of Lake Nsezi on Nseleni |

|
2017-03-01 |
1396 |
- |
10 |
7.1 |
24.5 |
HIGH |
low |
HIGH |
Med |
| 11 | 187079 | |
2017-03-13 |
933 |
- |
22 |
6.9 |
22.1 |
HIGH |
low |
HIGH |
low |
| 12 | 187190 [2-month plot]
Near Kwajobe on Mthala - downstream Point |

|
2017-03-06 |
2790 |
- |
731 |
7.4 |
27.6 |
HIGH |
Med |
HIGH |
Med |
| 12 | 187190 | |
2017-03-20 |
556 |
- |
51 |
8.0 |
23.1 |
HIGH |
low |
HIGH |
low |
| 13 | 187934 [2-month plot]
Near Yengweni on Neshe U/S of Muzi and Mkuze |

|
2017-03-06 |
1480 |
- |
81 |
7.5 |
26.4 |
HIGH |
low |
HIGH |
Med |
| 13 | 187934 | |
2017-03-20 |
63 |
- |
162 |
8.1 |
23.2 |
HIGH |
low |
low |
low |
| 14 | 187937 [2-month plot]
State Land on Mthambalala |

|
2017-03-06 |
181 |
- |
14 |
8.2 |
27.5 |
HIGH |
low |
low |
low |
| 14 | 187937 | |
2017-03-20 |
109 |
- |
10 |
8.1 |
23.4 |
HIGH |
low |
low |
low |
| 15 | 189765 [2-month plot]
Nhlozane on Mfule |

|
2017-03-01 |
156 |
- |
23 |
7.7 |
29.8 |
HIGH |
low |
low |
low |
| 15 | 189765 | |
2017-03-13 |
122 |
- |
28 |
7.5 |
28.5 |
HIGH |
low |
low |
low |
| 16 | 192933 [2-month plot]
Lake Chubu |

|
2017-03-01 |
31 |
- |
6 |
- |
30.1 |
HIGH |
low |
low |
low |
| 16 | 192933 | |
2017-03-08 |
31 |
- |
2 |
- |
21.3 |
HIGH |
low |
low |
low |
| 16 | 192933 | |
2017-03-13 |
1 |
- |
29 |
- |
28.7 |
Med |
low |
low |
low |


