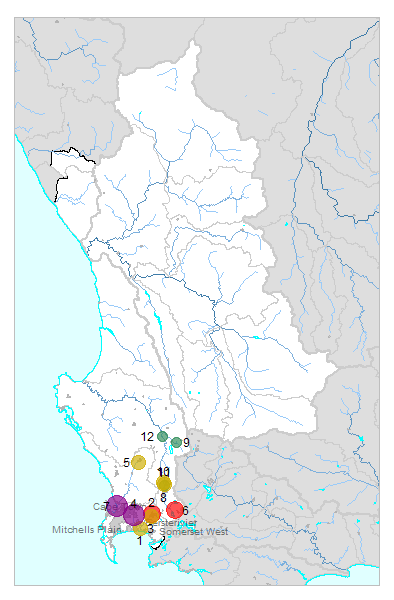
| № |
Site
[
view Berg_Olifants sites in Google Earth
]
|
Plot all data |
Date |
MPN, or cfu / 100mL
|
Turb.
NTU |
pH |
Temp.
oC |
Risk based on E. coli if recorded, otherwise on faecal coliforms |
| E. coli |
faecal coliforms |
drinking-
no treatment |
drinking-
limited treatment |
full or
partial
contact |
irrigation-
crops eaten raw |
| 1 | 183040 [2-month plot]
Klr 006 - Zandvliet Bridge downstream of Zandvliet Sewage Works |

|
2007-01-11 |
201 |
- |
13 |
7.6 |
- |
HIGH |
low |
Med |
low |
| 1 | 183040 | |
2007-01-25 |
2950 |
- |
6 |
7.4 |
- |
HIGH |
Med |
HIGH |
Med |
| 1 | 183040 | |
2007-02-08 |
61310 |
- |
8 |
7.5 |
- |
HIGH |
HIGH |
HIGH |
HIGH |
| 1 | 183040 | |
2007-02-22 |
100 |
- |
4 |
7.5 |
- |
HIGH |
low |
low |
low |
| 2 | 183042 [2-month plot]
Under Kayamandi below Corobrick Bridge adjacent to Plankenbrug |

|
2007-01-25 |
54750 |
- |
14 |
7.4 |
- |
HIGH |
HIGH |
HIGH |
HIGH |
| 2 | 183042 | |
2007-02-06 |
5460 |
- |
17 |
7.1 |
- |
HIGH |
Med |
HIGH |
HIGH |
| 2 | 183042 | |
2007-02-22 |
3310 |
- |
24 |
7.2 |
- |
HIGH |
Med |
HIGH |
Med |
| 3 | 183043 [2-month plot]
At Die Boord D/S of Eersterivier and Plankenbrug Confluence |

|
2007-01-25 |
2490 |
- |
4 |
7.0 |
- |
HIGH |
Med |
HIGH |
Med |
| 3 | 183043 | |
2007-02-06 |
850 |
- |
5 |
6.8 |
- |
HIGH |
low |
HIGH |
low |
| 3 | 183043 | |
2007-02-22 |
4190 |
- |
5 |
7.1 |
- |
HIGH |
Med |
HIGH |
HIGH |
| 4 | 187147 [2-month plot]
100 M D/S of Belville WWTW Discharge Point on Kuilsrivier |

|
2007-01-11 |
72700 |
- |
16 |
7.6 |
- |
HIGH |
HIGH |
HIGH |
HIGH |
| 4 | 187147 | |
2007-01-25 |
21870 |
- |
9 |
8.0 |
- |
HIGH |
HIGH |
HIGH |
HIGH |
| 4 | 187147 | |
2007-02-08 |
241920 |
- |
125 |
7.6 |
- |
HIGH |
HIGH |
HIGH |
HIGH |
| 5 | 187148 [2-month plot]
500M D/S of Malmesbury WWTW Discharge on Dieprivier |

|
2007-01-25 |
3076 |
- |
18 |
7.6 |
- |
HIGH |
Med |
HIGH |
Med |
| 5 | 187148 | |
2007-02-06 |
1860 |
- |
7 |
7.5 |
- |
HIGH |
low |
HIGH |
Med |
| 5 | 187148 | |
2007-02-22 |
1296 |
- |
8 |
7.5 |
- |
HIGH |
low |
HIGH |
Med |
| 6 | 187149 [2-month plot]
Fh 008 - Stiebeul River below Santa Rosa Street Bridge downstream of the Water Ingress |

|
2007-01-23 |
6170 |
- |
10 |
7.7 |
- |
HIGH |
Med |
HIGH |
HIGH |
| 6 | 187149 | |
2007-02-08 |
241920 |
- |
14 |
7.2 |
- |
HIGH |
HIGH |
HIGH |
HIGH |
| 6 | 187149 | |
2007-02-20 |
5210 |
- |
9 |
7.1 |
- |
HIGH |
Med |
HIGH |
HIGH |
| 7 | 187150 [2-month plot]
Otto du Plessis Bridge at Milnerton on Diep |

|
2007-01-25 |
129965 |
- |
18 |
7.5 |
- |
HIGH |
HIGH |
HIGH |
HIGH |
| 7 | 187150 | |
2007-02-06 |
27550 |
- |
8 |
7.5 |
- |
HIGH |
HIGH |
HIGH |
HIGH |
| 7 | 187150 | |
2007-02-22 |
120331 |
- |
77 |
7.3 |
- |
HIGH |
HIGH |
HIGH |
HIGH |
| 8 | 187154 [2-month plot]
D/S of Paarl Sewage Works Discharge at Riviera Farm on Berg River |

|
2007-01-23 |
364 |
- |
4 |
7.8 |
- |
HIGH |
low |
Med |
low |
| 8 | 187154 | |
2007-02-08 |
384 |
- |
4 |
7.4 |
- |
HIGH |
low |
Med |
low |
| 8 | 187154 | |
2007-02-20 |
31 |
- |
2 |
7.3 |
- |
HIGH |
low |
low |
low |
| 9 | 187155 [2-month plot]
Mbr 014 - Tulbagh - at R46 Road Bridge on Klein-Berg River |

|
2007-01-23 |
236 |
- |
3 |
7.5 |
- |
HIGH |
low |
Med |
low |
| 10 | 187156 [2-month plot]
Mbr 004 - Wellington - D/S of Wellington WWTW at R44 Florida Road Bridge |

|
2007-01-23 |
959 |
- |
32 |
7.6 |
- |
HIGH |
low |
HIGH |
low |
| 10 | 187156 | |
2007-02-08 |
691 |
- |
14 |
7.0 |
- |
HIGH |
low |
HIGH |
low |
| 10 | 187156 | |
2007-02-20 |
933 |
- |
12 |
6.7 |
- |
HIGH |
low |
HIGH |
low |
| 11 | 187932 [2-month plot]
At Paarl downstream of WWTW + Informal Settlement on Berg |

|
2007-01-23 |
1421 |
- |
15 |
7.6 |
- |
HIGH |
low |
HIGH |
Med |
| 11 | 187932 | |
2007-02-08 |
313 |
- |
12 |
7.1 |
- |
HIGH |
low |
Med |
low |
| 11 | 187932 | |
2007-02-20 |
1664 |
- |
16 |
6.5 |
- |
HIGH |
low |
HIGH |
Med |
| 12 | 190309 [2-month plot]
No 6 Schoenemakersfontein 486 Saron at Goedverwag Bridge on Berg River |

|
2007-01-23 |
36 |
- |
5 |
7.8 |
- |
HIGH |
low |
low |
low |
| 12 | 190309 | |
2007-02-08 |
79 |
- |
38 |
7.2 |
- |
HIGH |
low |
low |
low |
| 12 | 190309 | |
2007-02-20 |
60 |
- |
42 |
6.8 |
- |
HIGH |
low |
low |
low |


