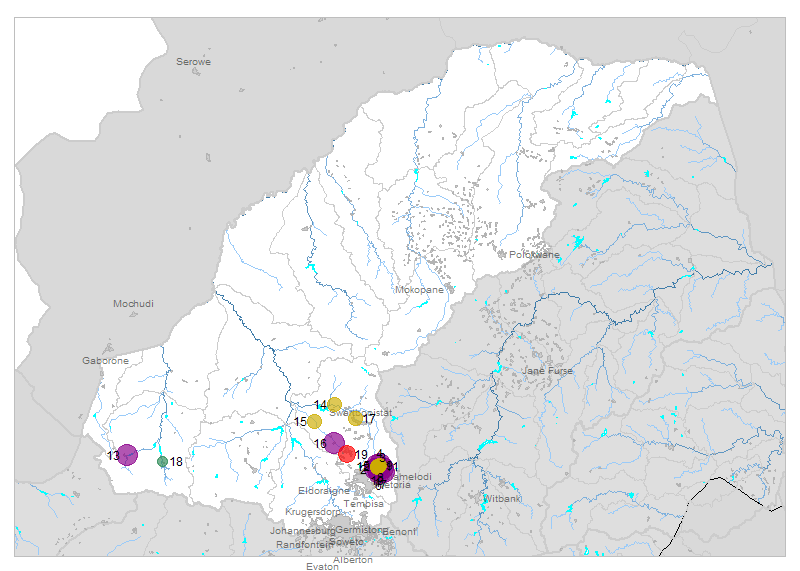
| № |
Site
[
view Limpopo sites in Google Earth
]
|
Plot all data |
Date |
MPN, or cfu / 100mL
|
Turb.
NTU |
pH |
Temp.
oC |
Risk based on E. coli if recorded, otherwise on faecal coliforms |
| E. coli |
faecal coliforms |
drinking-
no treatment |
drinking-
limited treatment |
full or
partial
contact |
irrigation-
crops eaten raw |
| 1 | 90174 [2-month plot]
Pienaars River at Baviaanspoort |

|
2023-01-16 |
77010 |
- |
- |
8.0 |
- |
HIGH |
HIGH |
HIGH |
HIGH |
| 1 | 90174 | |
2023-01-30 |
365400 |
- |
- |
- |
- |
HIGH |
HIGH |
HIGH |
HIGH |
| 1 | 90174 | |
2023-02-13 |
344800 |
- |
- |
7.6 |
- |
HIGH |
HIGH |
HIGH |
HIGH |
| 1 | 90174 | |
2023-02-27 |
686700 |
- |
- |
8.3 |
- |
HIGH |
HIGH |
HIGH |
HIGH |
| 2 | 90175 [2-month plot]
At Kameeldrift on Hartbeesspruit |

|
2023-01-16 |
1534 |
- |
- |
8.2 |
- |
HIGH |
low |
HIGH |
Med |
| 2 | 90175 | |
2023-01-30 |
325500 |
- |
- |
- |
- |
HIGH |
HIGH |
HIGH |
HIGH |
| 2 | 90175 | |
2023-02-13 |
241960 |
- |
- |
7.9 |
- |
HIGH |
HIGH |
HIGH |
HIGH |
| 2 | 90175 | |
2023-02-27 |
5226 |
- |
- |
8.2 |
- |
HIGH |
Med |
HIGH |
HIGH |
| 3 | 90176 [2-month plot]
At Leeuwfontein on Edendalspruit |

|
2023-01-16 |
62 |
- |
- |
- |
- |
HIGH |
low |
low |
low |
| 3 | 90176 | |
2023-01-30 |
20924 |
- |
- |
- |
- |
HIGH |
HIGH |
HIGH |
HIGH |
| 3 | 90176 | |
2023-02-13 |
198635 |
- |
- |
7.3 |
- |
HIGH |
HIGH |
HIGH |
HIGH |
| 3 | 90176 | |
2023-02-27 |
48392 |
- |
- |
8.0 |
- |
HIGH |
HIGH |
HIGH |
HIGH |
| 4 | 90234 [2-month plot]
Roodeplaat Sewage: Settling Pond S Outflow |

|
2023-01-16 |
31062 |
- |
- |
- |
- |
HIGH |
HIGH |
HIGH |
HIGH |
| 4 | 90234 | |
2023-01-30 |
770100 |
- |
- |
- |
- |
HIGH |
HIGH |
HIGH |
HIGH |
| 4 | 90234 | |
2023-02-13 |
4020 |
- |
- |
8.0 |
- |
HIGH |
Med |
HIGH |
HIGH |
| 4 | 90234 | |
2023-02-27 |
48392 |
- |
- |
8.4 |
- |
HIGH |
HIGH |
HIGH |
HIGH |
| 5 | 90236 [2-month plot]
Zeekoegat Sewage Effluent |

|
2023-01-16 |
4500 |
- |
- |
- |
- |
HIGH |
Med |
HIGH |
HIGH |
| 5 | 90236 | |
2023-01-30 |
7545 |
- |
- |
- |
- |
HIGH |
Med |
HIGH |
HIGH |
| 5 | 90236 | |
2023-02-13 |
41060 |
- |
- |
7.6 |
- |
HIGH |
HIGH |
HIGH |
HIGH |
| 5 | 90236 | |
2023-02-27 |
633050 |
- |
- |
8.2 |
- |
HIGH |
HIGH |
HIGH |
HIGH |
| 6 | 90237 [2-month plot]
Baviaanspoort Sewage Effluent |

|
2023-01-16 |
2419600 |
- |
- |
- |
- |
HIGH |
HIGH |
HIGH |
HIGH |
| 6 | 90237 | |
2023-01-30 |
980400 |
- |
- |
- |
- |
HIGH |
HIGH |
HIGH |
HIGH |
| 6 | 90237 | |
2023-02-13 |
1553100 |
- |
- |
7.8 |
- |
HIGH |
HIGH |
HIGH |
HIGH |
| 6 | 90237 | |
2023-02-27 |
1986300 |
- |
- |
8.3 |
- |
HIGH |
HIGH |
HIGH |
HIGH |
| 7 | 90238 [2-month plot]
At Franspoort Road Bridge on Edendalspruit |

|
2023-01-16 |
1119900 |
- |
- |
- |
- |
HIGH |
HIGH |
HIGH |
HIGH |
| 7 | 90238 | |
2023-01-30 |
1732900 |
- |
- |
- |
- |
HIGH |
HIGH |
HIGH |
HIGH |
| 7 | 90238 | |
2023-02-13 |
387300 |
- |
- |
- |
- |
HIGH |
HIGH |
HIGH |
HIGH |
| 7 | 90238 | |
2023-02-27 |
1986300 |
- |
- |
7.9 |
- |
HIGH |
HIGH |
HIGH |
HIGH |
| 8 | 90275 [2-month plot]
Roodeplaat Dam on Pienaars River: near Dam Wall |

|
2023-01-17 |
0 |
- |
- |
7.9 |
- |
low |
low |
low |
low |
| 8 | 90275 | |
2023-01-30 |
9 |
- |
- |
- |
- |
Med |
low |
low |
low |
| 8 | 90275 | |
2023-02-13 |
411 |
- |
- |
- |
- |
HIGH |
low |
HIGH |
low |
| 8 | 90275 | |
2023-02-27 |
94 |
- |
- |
7.6 |
- |
HIGH |
low |
low |
low |
| 9 | 90276 [2-month plot]
Roodeplaat Dam on Pienaars River: Point in Dam |

|
2023-01-30 |
30 |
- |
- |
- |
- |
HIGH |
low |
low |
low |
| 9 | 90276 | |
2023-02-13 |
1961 |
- |
- |
7.8 |
- |
HIGH |
low |
HIGH |
Med |
| 9 | 90276 | |
2023-02-27 |
1901 |
- |
- |
- |
- |
HIGH |
low |
HIGH |
Med |
| 10 | 90281 [2-month plot]
Roodeplaat Dam on Pienaars River: Point in Dam |

|
2023-01-30 |
111 |
- |
- |
6.9 |
- |
HIGH |
low |
low |
low |
| 10 | 90281 | |
2023-02-13 |
4884 |
- |
- |
- |
- |
HIGH |
Med |
HIGH |
HIGH |
| 10 | 90281 | |
2023-02-27 |
626 |
- |
- |
- |
- |
HIGH |
low |
HIGH |
low |
| 11 | 90283 [2-month plot]
Roodeplaat Dam on Pienaars River: Point in Dam |

|
2023-01-30 |
4 |
- |
- |
8.4 |
- |
Med |
low |
low |
low |
| 11 | 90283 | |
2023-02-13 |
2420 |
- |
- |
7.2 |
- |
HIGH |
Med |
HIGH |
Med |
| 11 | 90283 | |
2023-02-27 |
1633 |
- |
- |
- |
- |
HIGH |
low |
HIGH |
Med |
| 12 | 90284 [2-month plot]
Roodeplaat Dam on Pienaars River: Point in Dam |

|
2023-01-30 |
2 |
- |
- |
- |
- |
Med |
low |
low |
low |
| 12 | 90284 | |
2023-02-13 |
2828 |
- |
- |
- |
- |
HIGH |
Med |
HIGH |
Med |
| 12 | 90284 | |
2023-02-27 |
10950 |
- |
- |
- |
- |
HIGH |
Med |
HIGH |
HIGH |
| 13 | 90322 [2-month plot]
Zeerust Hazia 240 JP - at R27 Road Bridge on Kareespruit, D/S of Zeerust WWTW |

|
2023-01-16 |
3448000 |
- |
- |
- |
- |
HIGH |
HIGH |
HIGH |
HIGH |
| 13 | 90322 | |
2023-01-30 |
4611000 |
- |
- |
- |
- |
HIGH |
HIGH |
HIGH |
HIGH |
| 13 | 90322 | |
2023-02-13 |
2419600 |
- |
- |
- |
- |
HIGH |
HIGH |
HIGH |
HIGH |
| 13 | 90322 | |
2023-02-27 |
1732900 |
- |
- |
- |
- |
HIGH |
HIGH |
HIGH |
HIGH |
| 14 | 179682 [2-month plot]
Moretele River at Sutelong/Rt Tarrbridge |

|
2023-01-18 |
736 |
- |
2 |
- |
- |
HIGH |
low |
HIGH |
low |
| 14 | 179682 | |
2023-02-01 |
6896 |
- |
133 |
7.6 |
23.5 |
HIGH |
Med |
HIGH |
HIGH |
| 14 | 179682 | |
2023-02-15 |
432 |
- |
4 |
7.6 |
25.2 |
HIGH |
low |
HIGH |
low |
| 15 | 179683 [2-month plot]
Tolwane River at Legonyane 5M U/S Bridge |

|
2023-01-18 |
1920 |
- |
49 |
- |
- |
HIGH |
low |
HIGH |
Med |
| 15 | 179683 | |
2023-02-01 |
18416 |
- |
224 |
7.8 |
21.6 |
HIGH |
Med |
HIGH |
HIGH |
| 15 | 179683 | |
2023-02-15 |
3808 |
- |
69 |
7.8 |
23.6 |
HIGH |
Med |
HIGH |
Med |
| 16 | 179684 [2-month plot]
Sand River at Madidi/50M D/S Left of River |

|
2023-01-18 |
120330 |
- |
2 |
- |
- |
HIGH |
HIGH |
HIGH |
HIGH |
| 16 | 179684 | |
2023-02-01 |
435200 |
- |
52 |
7.8 |
22.1 |
HIGH |
HIGH |
HIGH |
HIGH |
| 16 | 179684 | |
2023-02-15 |
16580 |
- |
27 |
7.8 |
23.6 |
HIGH |
Med |
HIGH |
HIGH |
| 17 | 180555 [2-month plot]
Apies at Makapanstad -Swartdamstad/Hammanskraal Rd |

|
2023-01-18 |
3450 |
- |
1 |
- |
- |
HIGH |
Med |
HIGH |
Med |
| 17 | 180555 | |
2023-02-01 |
12976 |
- |
48 |
7.9 |
22.9 |
HIGH |
Med |
HIGH |
HIGH |
| 17 | 180555 | |
2023-02-15 |
2028 |
- |
22 |
7.7 |
24.4 |
HIGH |
Med |
HIGH |
Med |
| 18 | 188261 [2-month plot]
A3GMAR Groot- Marico Wonderfontein 258 JP - at N4 Road Bridge on Groot Marico Rivier |

|
2023-01-16 |
196 |
- |
- |
- |
- |
HIGH |
low |
low |
low |
| 18 | 188261 | |
2023-01-30 |
435 |
- |
- |
- |
- |
HIGH |
low |
HIGH |
low |
| 18 | 188261 | |
2023-02-13 |
816 |
- |
- |
- |
- |
HIGH |
low |
HIGH |
low |
| 18 | 188261 | |
2023-02-27 |
323 |
- |
- |
- |
- |
HIGH |
low |
Med |
low |
| 19 | 100000815 [2-month plot]
Isg 3 Itsoseng Tributary Confluence |

|
2023-01-18 |
7866 |
- |
28 |
- |
- |
HIGH |
Med |
HIGH |
HIGH |
| 19 | 100000815 | |
2023-02-01 |
39726 |
- |
8 |
7.8 |
21.7 |
HIGH |
HIGH |
HIGH |
HIGH |
| 19 | 100000815 | |
2023-02-15 |
18416 |
- |
7 |
7.6 |
22.3 |
HIGH |
Med |
HIGH |
HIGH |


