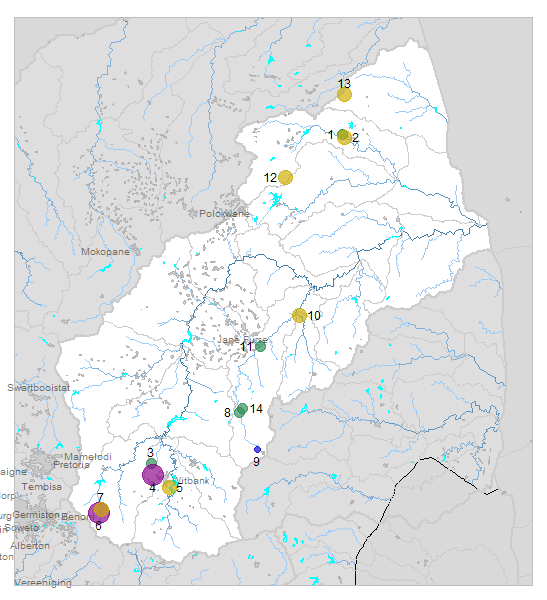
| № |
Site
[
view Olifants sites in Google Earth
]
|
Plot all data |
Date |
MPN, or cfu / 100mL
|
Turb.
NTU |
pH |
Temp.
oC |
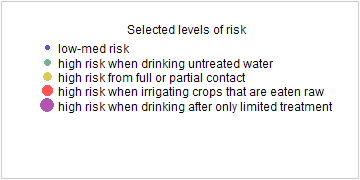
Risk based on E. coli if recorded, otherwise on faecal coliforms |
| E. coli |
faecal coliforms |
drinking-
no treatment |
drinking-
limited treatment |
full or
partial
contact |
irrigation-
crops eaten raw |
| 1 | 183878 [2-month plot]
Giyani upstream of STW near R81 Adolf Mhinga Bridge on Klein Letaba River |

|
2014-11-26 |
326 |
- |
3 |
7.7 |
- |
HIGH |
low |
Med |
low |
| 2 | 183879 [2-month plot]
Downstream of Giyani Sewage Works at Irrigation Abstraction |

|
2014-11-26 |
2420 |
- |
18 |
7.5 |
- |
HIGH |
Med |
HIGH |
Med |
| 3 | 185084 [2-month plot]
Hartbeestspruit at Bridge D/S Brugspruit Treatment Plant Klipspruit STW + Kro Omdraai Mine on Brugspr |

|
2014-12-11 |
214 |
- |
- |
5.4 |
- |
HIGH |
low |
Med |
low |
| 4 | 185085 [2-month plot]
Kwaguqa D/S Ferrobank STW U/S of Water Treatment Plant on Brugspruit T |

|
2014-11-03 |
- |
2000000 |
- |
- |
- |
HIGH |
HIGH |
HIGH |
HIGH |
| 4 | 185085 | |
2014-12-01 |
- |
5000000 |
- |
- |
- |
HIGH |
HIGH |
HIGH |
HIGH |
| 5 | 188538 [2-month plot]
Naauwpoort 335 JS downstream of Naauwpoort Sewage Works on Noupoortspruit |

|
2014-11-03 |
- |
1300 |
- |
- |
- |
HIGH |
low |
HIGH |
Med |
| 5 | 188538 | |
2014-11-18 |
1733 |
- |
- |
7.1 |
- |
HIGH |
low |
HIGH |
Med |
| 5 | 188538 | |
2014-12-01 |
- |
12000 |
- |
- |
- |
HIGH |
Med |
HIGH |
HIGH |
| 5 | 188538 | |
2014-12-02 |
4 |
- |
- |
6.8 |
- |
Med |
low |
low |
low |
| 6 | 188610 [2-month plot]
Delmas at Low Water Bridge D/S Delmas STW on Unnamed Stream from Witklip |

|
2014-11-03 |
- |
130000 |
- |
- |
- |
HIGH |
HIGH |
HIGH |
HIGH |
| 6 | 188610 | |
2014-12-01 |
- |
110000 |
- |
- |
- |
HIGH |
HIGH |
HIGH |
HIGH |
| 6 | 188610 | |
2014-12-08 |
2420 |
- |
- |
6.0 |
- |
HIGH |
Med |
HIGH |
Med |
| 7 | 188729 [2-month plot]
Middelburg 231 IR Botleng (Leeuspruit) U/S Pump Station on Bronkhorstspruit Trib 2 |

|
2014-11-03 |
- |
2000 |
- |
- |
- |
HIGH |
Med |
HIGH |
Med |
| 7 | 188729 | |
2014-12-01 |
- |
2000 |
- |
- |
- |
HIGH |
Med |
HIGH |
Med |
| 8 | 188910 [2-month plot]
Blinkwater at R555 Bridge from Steelpoort to Stofberg on Steelpoort River |

|
2014-11-05 |
- |
100 |
- |
- |
- |
HIGH |
low |
low |
low |
| 8 | 188910 | |
2014-11-19 |
- |
130 |
- |
- |
- |
HIGH |
low |
low |
low |
| 9 | 188911 [2-month plot]
Weltevreden at Belfast Dam U/S Dam Wall on Belfast Dam |

|
2014-11-25 |
- |
8 |
- |
- |
- |
Med |
low |
low |
low |
| 10 | 188912 [2-month plot]
Spekboom River at Bridge D/S Burgersfort Sewage Works |

|
2014-11-05 |
- |
2700 |
- |
- |
- |
HIGH |
Med |
HIGH |
Med |
| 10 | 188912 | |
2014-11-19 |
- |
600 |
- |
- |
- |
HIGH |
low |
HIGH |
low |
| 11 | 188915 [2-month plot]
Steelpoortdrift at R555 Road Bridge to Sekhukhune on Steelpoortrivier |

|
2014-11-05 |
- |
60 |
- |
- |
- |
HIGH |
low |
low |
low |
| 11 | 188915 | |
2014-11-19 |
- |
180 |
- |
- |
- |
HIGH |
low |
low |
low |
| 12 | 190140 [2-month plot]
Ga-Kgapane downstream of Sewage Treatment Works on Modubatse River |

|
2014-11-26 |
2420 |
- |
12 |
7.5 |
- |
HIGH |
Med |
HIGH |
Med |
| 13 | 190183 [2-month plot]
Boltman 211 LT - Malamulele downstream Malamulele STW Bridge After Dam on Manzworo River |

|
2014-11-24 |
1203 |
- |
- |
- |
- |
HIGH |
low |
HIGH |
Med |
| 14 | 1000009854 [2-month plot]
Witpoort River at R555 Bridge from Steelpoort to Stoffberg |

|
2014-11-05 |
- |
108 |
- |
- |
- |
HIGH |
low |
low |
low |
| 14 | 1000009854 | |
2014-11-19 |
- |
170 |
- |
- |
- |
HIGH |
low |
low |
low |


