| № |
Site
[
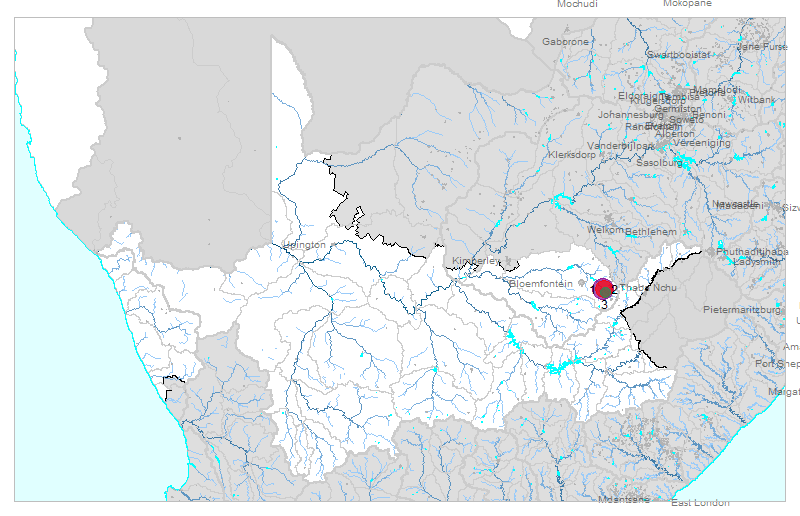
view Orange sites in Google Earth
]
|
Plot all data |
Date |
MPN, or cfu / 100mL
|
Turb.
NTU |
pH |
Temp.
oC |
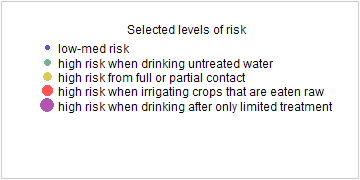
Risk based on E. coli if recorded, otherwise on faecal coliforms |
| E. coli |
faecal coliforms |
drinking-
no treatment |
drinking-
limited treatment |
full or
partial
contact |
irrigation-
crops eaten raw |
| 1 | 182329 [2-month plot]
Botshabelo 3 at Bridge downstream of Pse Outflow |

|
2000-02-15 |
- |
480000 |
- |
- |
- |
HIGH |
HIGH |
HIGH |
HIGH |
| 1 | 182329 | |
2000-02-22 |
- |
65667 |
- |
- |
- |
HIGH |
HIGH |
HIGH |
HIGH |
| 1 | 182329 | |
2000-02-28 |
- |
18667 |
- |
- |
- |
HIGH |
Med |
HIGH |
HIGH |
| 2 | 182330 [2-month plot]
Botshabelo 2 Final City Exit Point upstream of Pse Outflow |

|
2000-02-15 |
- |
11000 |
- |
- |
- |
HIGH |
Med |
HIGH |
HIGH |
| 2 | 182330 | |
2000-02-22 |
- |
187 |
- |
- |
- |
HIGH |
low |
low |
low |
| 2 | 182330 | |
2000-02-28 |
- |
6300 |
- |
- |
- |
HIGH |
Med |
HIGH |
HIGH |
| 3 | 182332 [2-month plot]
Botshabelo 1 Runs Through Suburb Collecting Residential Waste |

|
2000-02-15 |
- |
397 |
- |
- |
- |
HIGH |
low |
Med |
low |
| 3 | 182332 | |
2000-02-22 |
- |
300 |
- |
- |
- |
HIGH |
low |
Med |
low |
| 3 | 182332 | |
2000-02-28 |
- |
1600 |
- |
- |
- |
HIGH |
low |
HIGH |
Med |


