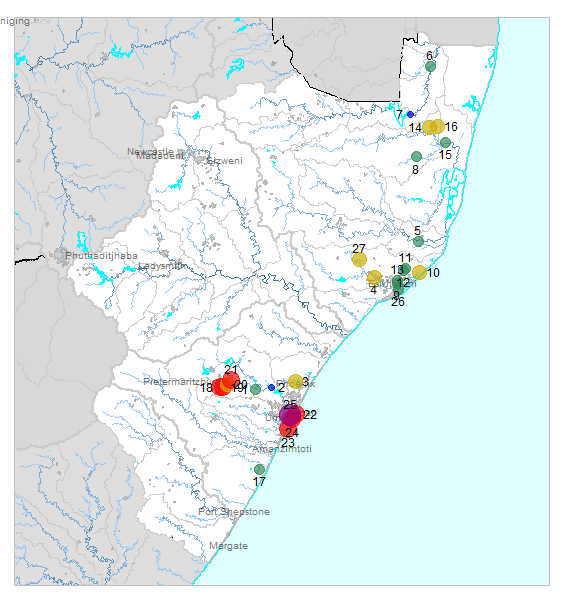
| № |
Site
[
view Pongola_Mtamvuna sites in Google Earth
]
|
Plot all data |
Date |
MPN, or cfu / 100mL
|
Turb.
NTU |
pH |
Temp.
oC |
Risk based on E. coli if recorded, otherwise on faecal coliforms |
| E. coli |
faecal coliforms |
drinking-
no treatment |
drinking-
limited treatment |
full or
partial
contact |
irrigation-
crops eaten raw |
| 1 | 102632 [2-month plot]
Msunduze River at Inanda/Nomfihlelo |

|
2012-07-15 |
242 |
484000 |
5 |
7.6 |
- |
HIGH |
low |
Med |
low |
| 1 | 102632 | |
2012-07-28 |
6 |
484000 |
2 |
7.2 |
- |
Med |
low |
low |
low |
| 1 | 102632 | |
2012-08-16 |
350 |
370000 |
4 |
7.5 |
- |
HIGH |
low |
Med |
low |
| 2 | 102662 [2-month plot]
Mgeni River at Inanda/Mumbundwini up/S Inanda Dam |

|
2012-07-15 |
10 |
484000 |
1 |
7.5 |
- |
HIGH |
low |
low |
low |
| 2 | 102662 | |
2012-07-26 |
10 |
484000 |
1 |
7.4 |
- |
HIGH |
low |
low |
low |
| 2 | 102662 | |
2012-08-16 |
24000 |
2400000 |
6 |
7.8 |
- |
HIGH |
HIGH |
HIGH |
HIGH |
| 3 | 102674 [2-month plot]
Mdloti River at Roodekrans/Hazelmere Dam Inflow (Roodekrans) |

|
2012-07-13 |
40 |
484000 |
2 |
7.3 |
- |
HIGH |
low |
low |
low |
| 3 | 102674 | |
2012-07-29 |
1 |
484000 |
1 |
7.6 |
- |
Med |
low |
low |
low |
| 3 | 102674 | |
2012-08-15 |
3300 |
2400000 |
13 |
7.5 |
- |
HIGH |
Med |
HIGH |
Med |
| 3 | 102674 | |
2012-08-29 |
24000 |
2400000 |
7 |
7.3 |
- |
HIGH |
HIGH |
HIGH |
HIGH |
| 4 | 102809 [2-month plot]
Mhlatuze River at Riverview 11459 |

|
2012-07-12 |
- |
272 |
14 |
8.3 |
- |
HIGH |
low |
Med |
low |
| 4 | 102809 | |
2012-07-25 |
- |
2584 |
10 |
8.3 |
- |
HIGH |
Med |
HIGH |
Med |
| 4 | 102809 | |
2012-08-08 |
- |
649 |
9 |
8.3 |
- |
HIGH |
low |
HIGH |
low |
| 4 | 102809 | |
2012-08-20 |
- |
326 |
10 |
8.3 |
- |
HIGH |
low |
Med |
low |
| 5 | 102839 [2-month plot]
Mfolozi River at Reserve no 5/Gwa-Msane |

|
2012-07-12 |
- |
345 |
20 |
7.7 |
- |
HIGH |
low |
Med |
low |
| 5 | 102839 | |
2012-07-25 |
- |
435 |
10 |
8.4 |
- |
HIGH |
low |
HIGH |
low |
| 5 | 102839 | |
2012-08-08 |
- |
980 |
8 |
8.6 |
- |
HIGH |
low |
HIGH |
low |
| 5 | 102839 | |
2012-08-20 |
- |
111 |
4 |
8.4 |
- |
HIGH |
low |
low |
low |
| 6 | 102902 [2-month plot]
At Lake View Ndumu Kangazini on Pongolo |

|
2012-07-12 |
- |
135 |
9 |
8.3 |
- |
HIGH |
low |
low |
low |
| 7 | 102905 [2-month plot]
Pongolapoort Dam on Phongolo River: downstream Weir |

|
2012-07-12 |
- |
9 |
3 |
8.2 |
- |
Med |
low |
low |
low |
| 8 | 172387 [2-month plot]
Umsinduzi |

|
2012-07-12 |
- |
687 |
2 |
8.2 |
- |
HIGH |
low |
HIGH |
low |
| 8 | 172387 | |
2012-07-25 |
- |
148 |
5 |
8.4 |
- |
HIGH |
low |
low |
low |
| 8 | 172387 | |
2012-08-08 |
- |
161 |
5 |
8.3 |
- |
HIGH |
low |
low |
low |
| 8 | 172387 | |
2012-08-20 |
- |
185 |
3 |
8.2 |
- |
HIGH |
low |
low |
low |
| 9 | 177769 [2-month plot]
Mhlatuze River at Umhlatuze Valley |

|
2012-07-12 |
- |
210 |
13 |
7.2 |
- |
HIGH |
low |
Med |
low |
| 9 | 177769 | |
2012-07-25 |
- |
326 |
11 |
8.0 |
- |
HIGH |
low |
Med |
low |
| 9 | 177769 | |
2012-08-08 |
- |
291 |
14 |
8.0 |
- |
HIGH |
low |
Med |
low |
| 9 | 177769 | |
2012-08-20 |
- |
8 |
14 |
7.8 |
- |
Med |
low |
low |
low |
| 10 | 183757 [2-month plot]
Mdibi River at Bridge to RBM |

|
2012-07-12 |
- |
1046 |
7 |
7.5 |
- |
HIGH |
low |
HIGH |
Med |
| 10 | 183757 | |
2012-07-25 |
- |
376 |
8 |
7.6 |
- |
HIGH |
low |
Med |
low |
| 10 | 183757 | |
2012-08-08 |
- |
77010 |
8 |
7.5 |
- |
HIGH |
HIGH |
HIGH |
HIGH |
| 10 | 183757 | |
2012-08-20 |
- |
435 |
4 |
7.5 |
- |
HIGH |
low |
HIGH |
low |
| 11 | 183761 [2-month plot]
Mposa River Under Bridge |

|
2012-07-12 |
- |
1166 |
10 |
7.2 |
- |
HIGH |
low |
HIGH |
Med |
| 11 | 183761 | |
2012-07-25 |
- |
222 |
10 |
7.6 |
- |
HIGH |
low |
Med |
low |
| 11 | 183761 | |
2012-08-08 |
- |
185 |
9 |
7.7 |
- |
HIGH |
low |
low |
low |
| 11 | 183761 | |
2012-08-20 |
- |
140 |
10 |
7.5 |
- |
HIGH |
low |
low |
low |
| 12 | 187078 [2-month plot]
Between N2 Bridge and Mposa Confluence on Nseleni |

|
2012-07-12 |
- |
33 |
30 |
7.5 |
- |
HIGH |
low |
low |
low |
| 12 | 187078 | |
2012-07-25 |
- |
46 |
31 |
8.0 |
- |
HIGH |
low |
low |
low |
| 12 | 187078 | |
2012-08-08 |
- |
28 |
34 |
8.1 |
- |
HIGH |
low |
low |
low |
| 12 | 187078 | |
2012-08-20 |
- |
20 |
29 |
8.0 |
- |
HIGH |
low |
low |
low |
| 13 | 187079 [2-month plot]
At Road Bridge downstream of Lake Nsezi on Nseleni |

|
2012-07-12 |
- |
185 |
14 |
6.9 |
- |
HIGH |
low |
low |
low |
| 13 | 187079 | |
2012-07-25 |
- |
105 |
18 |
7.1 |
- |
HIGH |
low |
low |
low |
| 13 | 187079 | |
2012-08-08 |
- |
62 |
15 |
7.1 |
- |
HIGH |
low |
low |
low |
| 13 | 187079 | |
2012-08-20 |
- |
52 |
15 |
7.0 |
- |
HIGH |
low |
low |
low |
| 14 | 187190 [2-month plot]
Near Kwajobe on Mthala - downstream Point |

|
2012-07-12 |
- |
2420 |
60 |
8.3 |
- |
HIGH |
Med |
HIGH |
Med |
| 15 | 187934 [2-month plot]
Near Yengweni on Neshe U/S of Muzi and Mkuze |

|
2012-07-12 |
- |
47 |
20 |
8.3 |
- |
HIGH |
low |
low |
low |
| 16 | 187937 [2-month plot]
State Land on Mthambalala |

|
2012-07-12 |
- |
649 |
113 |
8.2 |
- |
HIGH |
low |
HIGH |
low |
| 17 | 187958 [2-month plot]
Umzinto EJ Smith Inflow on Mzimayi |

|
2012-07-15 |
60 |
484000 |
2 |
7.9 |
- |
HIGH |
low |
low |
low |
| 17 | 187958 | |
2012-07-26 |
1 |
484000 |
1 |
7.7 |
- |
Med |
low |
low |
low |
| 17 | 187958 | |
2012-08-15 |
2410 |
2400000 |
5 |
7.7 |
- |
HIGH |
Med |
HIGH |
Med |
| 17 | 187958 | |
2012-08-29 |
580 |
2400000 |
3 |
7.6 |
- |
HIGH |
low |
HIGH |
low |
| 18 | 187959 [2-month plot]
Caluza at Bridge on Msunduze |

|
2012-07-14 |
4840 |
484000 |
5 |
7.4 |
- |
HIGH |
Med |
HIGH |
HIGH |
| 18 | 187959 | |
2012-07-29 |
4840 |
484000 |
3 |
7.5 |
- |
HIGH |
Med |
HIGH |
HIGH |
| 18 | 187959 | |
2012-08-16 |
24000 |
2400000 |
35 |
7.3 |
- |
HIGH |
HIGH |
HIGH |
HIGH |
| 19 | 187960 [2-month plot]
Edendale downstream of Kwapata on Msunduze |

|
2012-07-14 |
4840 |
484000 |
2 |
7.6 |
- |
HIGH |
Med |
HIGH |
HIGH |
| 19 | 187960 | |
2012-07-29 |
1382 |
484000 |
1 |
7.6 |
- |
HIGH |
low |
HIGH |
Med |
| 19 | 187960 | |
2012-08-16 |
24000 |
2400000 |
2 |
7.6 |
- |
HIGH |
HIGH |
HIGH |
HIGH |
| 20 | 187961 [2-month plot]
Camp S Drift on Msunduze |

|
2012-07-14 |
1382 |
484000 |
6 |
7.5 |
- |
HIGH |
low |
HIGH |
Med |
| 20 | 187961 | |
2012-07-29 |
198 |
484000 |
2 |
7.5 |
- |
HIGH |
low |
low |
low |
| 20 | 187961 | |
2012-08-16 |
24000 |
2400000 |
12 |
7.3 |
- |
HIGH |
HIGH |
HIGH |
HIGH |
| 21 | 187963 [2-month plot]
Pietermaritzburg Sobantu on Bayne S Spruit |

|
2012-07-13 |
4840 |
484000 |
- |
7.3 |
- |
HIGH |
Med |
HIGH |
HIGH |
| 21 | 187963 | |
2012-07-29 |
4840 |
484000 |
2 |
7.4 |
- |
HIGH |
Med |
HIGH |
HIGH |
| 21 | 187963 | |
2012-08-16 |
24000 |
2400000 |
3 |
7.3 |
- |
HIGH |
HIGH |
HIGH |
HIGH |
| 22 | 189144 [2-month plot]
Bulwer Before Entrance to la Habour on Mullet Canal |

|
2012-07-15 |
4840 |
484000 |
3 |
7.4 |
- |
HIGH |
Med |
HIGH |
HIGH |
| 22 | 189144 | |
2012-07-30 |
22 |
484000 |
3 |
7.8 |
- |
HIGH |
low |
low |
low |
| 22 | 189144 | |
2012-08-15 |
6900 |
2400000 |
13 |
7.3 |
- |
HIGH |
Med |
HIGH |
HIGH |
| 22 | 189144 | |
2012-08-29 |
24000 |
2400000 |
2 |
7.4 |
- |
HIGH |
HIGH |
HIGH |
HIGH |
| 23 | 189146 [2-month plot]
Isipingo at Isipingo Beach on Isipingo Lagoon |

|
2012-07-15 |
4840 |
484000 |
3 |
7.8 |
- |
HIGH |
Med |
HIGH |
HIGH |
| 23 | 189146 | |
2012-07-30 |
4840 |
484000 |
1 |
7.7 |
- |
HIGH |
Med |
HIGH |
HIGH |
| 23 | 189146 | |
2012-08-15 |
24000 |
2400000 |
8 |
7.8 |
- |
HIGH |
HIGH |
HIGH |
HIGH |
| 23 | 189146 | |
2012-08-29 |
24000 |
2400000 |
4 |
7.5 |
- |
HIGH |
HIGH |
HIGH |
HIGH |
| 24 | 189150 [2-month plot]
Clairwood Durban D/S M4 at Start of Mhlathuzana Canal on Mhlathuzana |

|
2012-07-15 |
1 |
200 |
4 |
8.1 |
- |
Med |
low |
low |
low |
| 24 | 189150 | |
2012-07-30 |
4840 |
484000 |
1 |
7.7 |
- |
HIGH |
Med |
HIGH |
HIGH |
| 24 | 189150 | |
2012-08-15 |
24000 |
2400000 |
19 |
7.6 |
- |
HIGH |
HIGH |
HIGH |
HIGH |
| 24 | 189150 | |
2012-08-29 |
10000 |
2400000 |
3 |
7.3 |
- |
HIGH |
Med |
HIGH |
HIGH |
| 25 | 189152 [2-month plot]
Umkumbaan U/S of Confluence of Umbilo on Mkhumbane |

|
2012-07-26 |
4840 |
484000 |
4 |
7.4 |
- |
HIGH |
Med |
HIGH |
HIGH |
| 25 | 189152 | |
2012-08-15 |
24000 |
2400000 |
4 |
7.5 |
- |
HIGH |
HIGH |
HIGH |
HIGH |
| 25 | 189152 | |
2012-08-29 |
24000 |
2400000 |
6 |
7.7 |
- |
HIGH |
HIGH |
HIGH |
HIGH |
| 26 | 189730 [2-month plot]
Reserve no 10 at Shembe Church Temple and Abstraction Point on Lake Cubhu |

|
2012-07-12 |
- |
53 |
14 |
7.3 |
- |
HIGH |
low |
low |
low |
| 26 | 189730 | |
2012-07-25 |
- |
50 |
1 |
7.4 |
- |
HIGH |
low |
low |
low |
| 26 | 189730 | |
2012-08-08 |
- |
93 |
15 |
7.5 |
- |
HIGH |
low |
low |
low |
| 26 | 189730 | |
2012-08-20 |
- |
21 |
4 |
7.4 |
- |
HIGH |
low |
low |
low |
| 27 | 189765 [2-month plot]
Nhlozane on Mfule |

|
2012-07-12 |
- |
687 |
2 |
8.0 |
- |
HIGH |
low |
HIGH |
low |
| 27 | 189765 | |
2012-07-25 |
- |
1553 |
3 |
8.1 |
- |
HIGH |
low |
HIGH |
Med |
| 27 | 189765 | |
2012-08-08 |
- |
1300 |
5 |
7.9 |
- |
HIGH |
low |
HIGH |
Med |
| 27 | 189765 | |
2012-08-20 |
- |
410 |
2 |
7.7 |
- |
HIGH |
low |
HIGH |
low |


