A8.1 Determination of Activity Concentration, Ai

The determination of annual average radionuclide activity concentrations at the various sites was complicated by the following factors:

not all the radionuclide activity concentrations were measured;

of those that were measured, not all were measured at all sampling sites;

fewer radionuclides were measured in the first phase of the study than in the second phase; and

some new sampling sites were added and some removed during the course of the study.

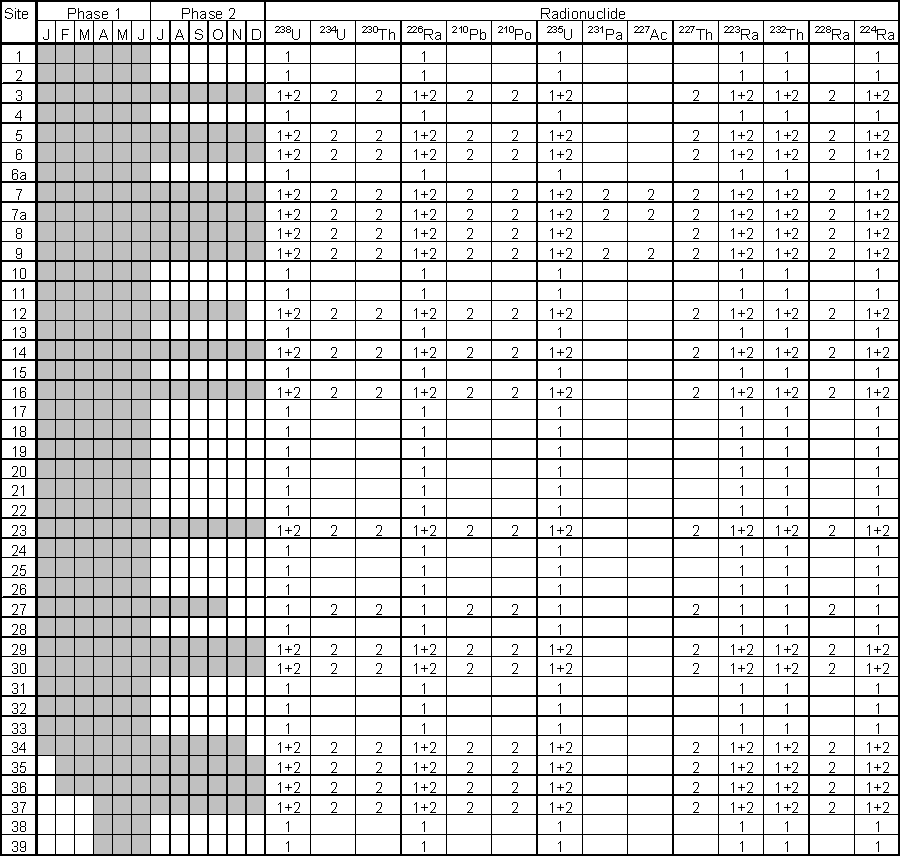
Details of the sampling data set are given in Table A8.1. The methods of dealing with the complications mentioned above are described in sections A8.1.1 to A8.1.3 below.

Table A8.1 Details of individual radionuclide measurements

1: measured only in phase 1

2: measured only in phase 2

1+2: measured in phases 1 and 2

Shaded areas indicate months during which measurements were made.

Complications also arose from the analysis techniques:

some radiochemical analyses involving very low activities gave negative values due to the statistical nature of the measurement technique; these negative values were included in the calculation of the annual mean values, but any annual mean values less than zero were set to zero.

some IPC-MS analyses involving very low activities gave values below the detection limit; these were set to half the detection limit.

A8.1.1 Estimating the activities of radionuclides not measured at some sites

The following radionuclides:

227Ac, 231Pa, 210Pb, 210Po, 228Ra and 230Th

were not measured at some sampling sites (see Table A8.1). It was found that, at the sites where these radionuclides were measured, the activity values were all very low and varied in a random fashion. The activity of each radionuclide at the sites where measurements were not made was therefore taken to be the mean value for that radionuclide calculated from all the samples at all other sites. The additional doses at the sites where these radionuclides were not measured, resulting from the use of these global mean values, are shown in Table A8.2. The doses are so small that even very large errors will be inconsequential.


Table A8.2 Dose contributions resulting from the use of global mean activity values

Radionuclide

Dose (Msv/a)

Actinium-227

0,0026

Protactinium-231

0,00008

Lead-210

0,0068

Polonium-210

0,0005

Radium-228

0,0088

Thorium-230

0.0005

A8.1.2 Estimating the activities of radionuclides never measured

The following radionuclides:

228Ac, 210Bi, 212Bi, 214Bi, 211Pb, 214Pb, 228Th, 231Th, and 234Th

having very low dose conversion factors, were never measured. The activity concentration of these radionuclides was simply taken to be equal to the mean activity of all measured radionuclides over all sites (0.00672 Bq/l ). On the basis of this assumption, the never-measured radionuclides contributed only 0.0005 mSv/a to the dose associated with each sampling site. This was deemed to be sufficiently small a contribution that no further sophistication was justified. For example, even if the activity concentration were to be underestimated by a factor of 3, the dose would be underestimated by only 0.001 mSv/a, a trivial amount.

In practice, the interquartile range (± 0.019 Bq/l ) of the mean values of all the measured radionuclides would be a fair first-order estimate of the range of uncertainty of the activity of the never-measured radionuclides. Thus, the uncertainty in the dose contributed by the never-measured radionuclides is 0.0028 mSv/a.

A8.1.3 Extrapolations for radionuclides not measured in phase 1

The following radionuclides:

227Ac, 231Pa, 210Pb, 228Ra, 227Th, 230Th and 234U

were measured only in phase 2 of the study. In an attempt to extrapolate the activities of these radionuclides into the phase 1 period, multilinear regressions were sought against chemical and radiation variables measured during Phase I.

The following procedure was used:

1. To decrease the noise influence of values near the detection limit, all values at or below the detection limit or within one standard deviation of 0, were discarded.

2. Those Phase I variables with relatively few values remaining were discarded.

It was also found that some of the stations, for example Station1, had exceedingly high (two orders of magnitude) values of certain variables, for example aluminum. Unfortunately, some stations, including Station 1, were dropped from sampling in the second half of the year. Thus including aluminum in the regression variables would result in extrapolating to aluminum values 100 times higher than were calibrated and tested on.

To ensure that this problem did not occur in other variables, the chosen predictors were inspected to ensure that the calibrating stations covered the full range for the variables.

Stations 10 and 2 had exceptionally high values of phosphate and calcium respectively. Phosphate at Station 10 was 5.7 standard deviations above the mean of the other stations. Calcium at Station 2 was 3 standard deviations above the mean of the other stations. Thus Ca and PO4-P were also excluded from the set of possible predictors.

Those variables left were:

Cl, EC, F, gross alpha, gross beta, K, Mg, Na, NH4-N, NO3+NO2-N, pH, Ra-223, Ra-226, Si, SO4, Sr-diss, TAL as CaCO3, TDS, U-235,

U-238.

3. All subsets shorter than 5 of these variables were tested.

4. For each Phase II variable and for each subset of Phase I variables the data was extracted.

5. If there were too few samples to get a good test of the significance of the fit, that subset was rejected.

6. The samples were divided into a calibration set and a test set.

7. The Phase II variable was fitted to the subset of the Phase I variables using the calibration set.

8. The goodness of fit parameter was calculated, using the regression calculated in the previous step, on the both the calibration and the test data sets. The worst value was reported and used in the next step.

9. The subset with the best-reported goodness of fit was selected.

The goodness of fit parameter was the sum of the squared residuals divided by the number of degrees of freedom, divided by the standard deviation of the variable being fitted i.e. Fitting a subset of length 0, would simply be the mean value of the variable being fitted. The goodness of fit parameter would then simply be 1.

Thus the goodness of fit tells you how much sharper (if < 1) your prediction is than simply taking the mean value as your predictor. It is never worth selecting a subset for which the goodness of fit parameter, is greater than or equal to 1.

It was possible, for only two of the Phase II nuclides (Th-227 and U-234), to find a subset of Phase I nuclides which improved our predictive ability. The per station doses are presented in Table 8.3.


Table 8.3 The per station doses.
Site No. Place Dose (mSv/year)
29 Turffontein 0,0184
30 Gerhardminnebron 0,0187
14 Gerhardminnebron-Rysmierbult road bridge upstream of Boskop dam 0,0191
35 Potchefstroom purification works-western abstraction point 0,0194
27 Welverdiend municipal water supply 2km south of Welverdiend 0,0206
34 Bovenste Eye 0,0226
6 Wonderfontein Eye-canal from Wonderfontein eye 0,0239
31 Wonderfontein Eye 110 is between piggery buildings 0,0261
26 Plot Welverdiend 0,0268
20 Kraalkop-old Johannesburg/Potchefstroom road bridge 0,0273
25 Plot no 9 Carltonville 0,0286
28 Blaaubank 100m east of house 0,0296
32 Plot 84 De Pan 0,0297
19 Elandsfontein-Johannesburg/Potchefstroom road bridge 0,0299
33 Plot Kraalkop 0,0305
22 Klipdrift dam-outflow into concrete irrigation canal 0,0306
18 Buffelsdoorn-Johannesburg/Potchefstroom road bridge 0,0314
24 Plot 40 Luipaardsvlei - 35m south east of farm house 0,0317
21 Weltevreden-Losberg/bank road bridge 0,0318
6a West Driefontein (down stream north shaft purification works) 0,0328
36 Potchefstroom purification works-eastern abstraction point 0,0335
38 Varkenslaagte 0,0341
16 Buffelsdoorn-Elandsrand gold mine 0,037
13 Turffontein-gravel road bridge to Muiskraal 0,0423
3 Luipaardsvlei (Doornkop Randfontein (R559) road bridge) 0,0536
10 Blyvooruitzicht gm-discharge to Doornfontn canal east of purification works 0,0563
4 No 7 at Gemsbokfontein 0,0568
2 Rietvlei (Randfontein Azaadville bridge) 0,0591
39 Doornfontein 0,0594
5 Wonderfontein-end of 1m pipe from Venterspost gold mine 0,0653
23 Gempost-Venterspost gold mine no 5 shaft 0,0761
37 Harry's dam 0,0786
8 Wonderfontein-low water bridge to Abe Bailey nature reserve 0,0805
17 Deelkraal-gold mine recreational dam overflow 0,0832
9 Blaauwbank 0,108
11 Doornfontein gold mine-gold plant discharge in canal upstream of Doornfontein excess 0,135
7 Rooipoort 0,155
15 Western Deep levels-farm bridge down stream of no 7 shaft slimes dam 0,178
1 Luipaardsvlei (at rail bridge from Turk shaft to 1st West gold mine 0,24
7a Carltonville West Driefontein gold mine –Carltonville cemetary road bridge 0,271
12 Doornfontein gold mine-number 3 shaft discharge 0,525


A8.1.4 The Uranium - Dose relationship

Plotting U-238 concentration against yearly dose and performing a least squares linear fit gives us the following relationship...

Dose = 0,0012895 * U + 0,0212758

Correlation coefficient r = 0,99063,