Appendix 9
METHOD USED FOR INDEPENDENT DOSE VERIFICATION
Evaluation of the Mooi River Catchment Study
1. Assumptions
To enable an "all nuclide" dose calculation the following has been assumed:
Th-234 and Pa-234m to be in equilibrium with U-238,
Rn-222, Po-218, Pb-214, Bi-214 and Po-214 to be in equilibrium with Ra-226,
Bi-210 to be in equilibrium with Pb-210,
Th-231 to be in equilibrium with U-235,
Rn-219, Po-215, Pb-211, Bi-211 and Tl-207 are in equilibrium with Ra-223,
Ac-228 to be in equilibrium with Ra-228, and
Rn-220, Po-216, Pb-212, Bi-212, Po-212 and Tl-208 in equilibrium with Ra-224.
Ac-227 at the time of sampling was calculated from two consecutive determinations of Th-227. The results for the three monitoring points surveyed for actinium (18 data) showed a good correlation between these mother-daughter nuclides (with a Th/Ac ratio of 6,12 ± 1,69). Accordingly the activity for the remainder of the samples in the second phase of the survey was estimated from the Th-227 data obtained.
Pa-231 did not show any direct correlation between the sampling points surveyed for this nuclide and the average concentration observed (0,2 ± 0,9 mBq/L) was taken as the default value for the global mean of the second phase of the Mooi River survey.
2. Dose Calculations and Correlations
According to paragraph one the evaluation has been performed for the most critical groups (i.e. the < 1 year olds followed by the age group between 12 and 17 years old) and the calculated lifetime average exposure. The following calculations were done to allow proper evaluation of the dose received during the one year period and to evaluate the possibility of using one unique monitor for the Mooi River catchment to estimate the yearly dose (instead of doing a full nuclide specific analysis):
- For the second phase of the study the "all nuclide" dose was calculated for the various age groups including the lifetime average dose.
- The same dose calculations were done, now using only the nuclides measured in the first phase of the study (i.e. U-238, U-235, Th-232, Ra-226, Ra-224 and Ra-223).
- We then determined the linear regression between these two calculated doses (i.e. the so-called "all nuclide" dose and the "phase 1" nuclide dose). The correlation obtained for "Lifetime average" use was:
[All nuclide dose] = 1,109 x [Phase 1 nuclides dose] + 0,017 (R2 = 0,980)
- The "phase 1" nuclide dose was then calculated for the same eighteen monitoring points surveyed in phase 1 of the study, and using the above correlations the "all nuclide" dose for these monitoring points was calculated.
- From the two sets of data (i.e. the "all nuclide" dose for the first and the second semester of 1997 for the eighteen corresponding sites; with the omission of one point that dried up during the second phase) the average ratio of the phase 1 to phase 2 "all nuclide" dose was calculated. This ratio was used to determine the "all nuclide" dose during phase 2 for the monitoring sites not surveyed in the second phase of the study. The average "all nuclide" dose was calculated, accordingly, from the phase 1 and phase 2 data. The results are shown in Table A for the lifetime average evaluation, the age group between 12 and 17 year old and the age groups of < 1 year old respectively.
- From the uranium data of the corresponding eighteen monitoring sites surveyed in both the first and the second semester of 1997 the average ratio of the phase 1 to phase 2 uranium concentrations (in µg/L) was calculated. This ratio was used to determine the uranium concentration during phase 2 for those monitoring sites not surveyed in the second phase of the study. From the phase 1 and phase 2 data the average uranium concentration was calculated.
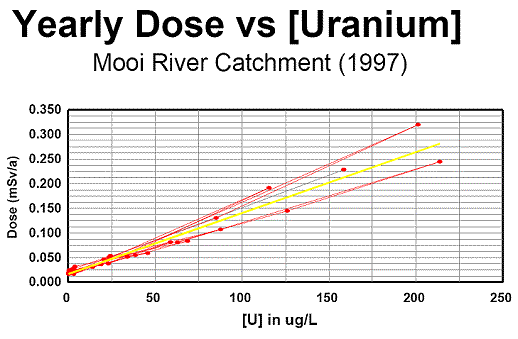
Table A: Average Analytical Results (Based on phase-2 radioanalytical data) - Thereafter, the linear regression between the average uranium concentration and the average "all nuclide" dose was calculated, using all monitoring sites in the evaluation. The following correlations were obtained, the last correlation being graphically represented in Graph A.< 1 year old: [All nuclide dose] (mSv/a) = 0,00409 x [U] (µg/L) + 0,063 (R2 = 0,932)
12 - 17 year old:[All nuclide dose] (mSv/a) = 0,00275 x [U] (µg/L) + 0,020 (R2 = 0,901)
Lifetime average:[All nuclide dose] (mSv/a) = 0,00124 x [U] (µg/L) + 0,017 (R2 = 0,970)

Last change: 2005-12-21 08:40