 |
Department of Water Affairs and Forestry |
| Institute for Water Quality Studies |
| Home | Contact us | Last updated : 10 July 2001 |
The Secchi disc readings (Figure 9) taken at Site 1 show a slight negative correlation with the chlorophyll-a concentrations (r² = -0.45). The suspended solids and the chlorophyll-a concentrations do have a significant correlation (r² = 0.58) indicating that the phytoplankton population forms a major component of the suspended matter in the impoundment. This indicates also towards the extent of the phytoplankton development in the Roodeplaat Dam. Considering the Secchi disc readings (Figure 9) of the Roodeplaat Dam, the impoundment is a deep, clear system.

Figure 11. Mean monthly temperature profiles in the Roodeplaat Dam at Site 1 (1980 to 1997)
The mean monthly temperature profiles (Figure 11) indicate a distinct thermocline, which forms between 7 m and 20 m from October to April within Roodeplaat Dam. The mean surface temperatures at Site 1 vary from 12.9 °C to 25.8 °C. Complete mixing, with constant temperatures right through the water column, is present during June and July. This phenomenon coupled to the oxygen contents in the water profile indicates the potential for nutrient releases from the bottom sediments.

Figure 12. Mean monthly oxygen profiles in the Roodeplaat Dam at Site 1 (1980 to 1997).
The mean monthly oxygen profiles (Figure 12) indicate the extent of anoxic waters in the Roodeplaat Dam at Site 1. The anaerobic hypolimnion establishes itself from August and prevails until April when the anoxic areas decrease until total mixing is present during June and July. The limited oxygenated areas within the profiles are an indication of the extent of eutrophication in the Roodeplaat Dam.
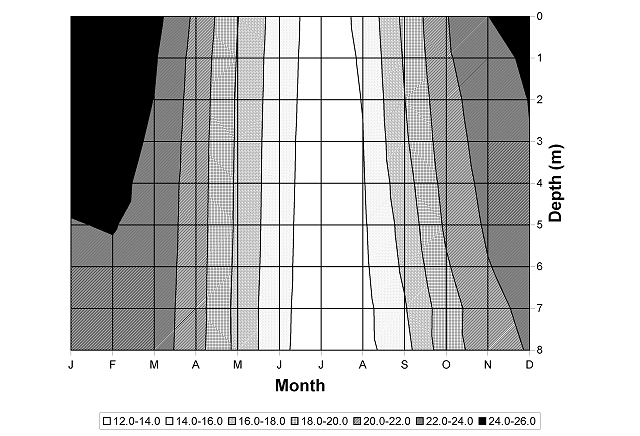
Site 7, shallower than Site 1, would have limnological characteristics similar to the site where the ‘pollution incident’ manifested itself. The mean monthly temperatures at Site 7 are shown in Figure 13. The warm temperatures during December to March of > 22 °C to a depth of 8 m, show the excellent conditions for primary production in this section of the impoundment. Because the site is shallow and light penetration would, therefore, be high, the conditions favour the development of the cyanobacterial community, especially Microcystis sp. that are scum-forming ecostrategists (Chorus and Bartram, 1999). Although the cells have gas vacuoles, the large quantities of carbohydrate, formed when the cells are near the surface during photosynthesis, acts as ballast and induces sinking of the colonies (Utilken et al., 1985). In the deeper, darker water the cells use the carbohydrates to synthesise new gas vacuoles. The ability to regulate their buoyancy enables the colonies to position themselves in optimal light and growth conditions.

Figure 13. Mean monthly temperature profiles in the Roodeplaat Dam at Site 7 (1990 to 1998). The temperature is expressed in degrees Centigrade.
Figure 14 indicates that the oxygen concentrations at the confluence of the Pienaars River and the Moreleta/Hartbees Spruit (Site 7) in the Roodeplaat Dam are high. During the winter period the oxygen profile shows complete mixing to the bottom waters. However, areas of almost anaerobic conditions prevail near the sediment during the summer periods (November to April). This phenomenon will enhance nutrient releases from the bottom sediments and contributes toward the higher nutrient concentrations and higher chlorophyll-a concentrations at this site, as compared to Site 1, as was found by Hohls et al. (1999).
 Figure 14. Mean monthly
oxygen profiles in the Roodeplaat Dam at Site 7 (1990 to 1998).
The oxygen concentration is expressed as mg/l of dissolved
oxygen.