 |
Department of Water Affairs and Forestry |
| Institute for Water Quality Studies |
| Home | Contact us | Last updated : 10 July 2001 |
Although decreasing water quality can be attributed to the increasing levels of a number of chemical species, the process of eutrophication describes nutrient enrichment of the water body (Henderson-Sellers and Markland, 1987). The location of a water body along an eutrophication scale from oligotrophic (nutrient poor conditions) to hyper-eutrophic (extreme nutrient enrichment) is called its trophic status.
The trophic status classification method in this report is based on the following variables and is based on the cut-off values as stated in Table 1.
Table 1. Trophic status indicators and the appropriate ranges used to classify the impoundment.
|
Variable |
Oligotrophic |
Mesotrophic |
Eutrophic |
Hyper-eutrophic |
|
Mean Chl a (µg/l ) |
0 –10 |
10 – 20 |
20 – 30 |
> 30 |
|
Proportion of time Chl a > 30 µg/l (%) |
0 |
< 8 |
8 – 50 |
>50 |
|
Total Phosphorus (mg/l ) |
< 0.015 |
0.015 – 0.047 |
0.047 – 0.130 |
> 0.130 |
|
Mean annual % cyanobacteria in phytoplankton population |
0 - 1 |
1 – 10 |
10 - 50 |
> 50 |
|
Mean annual transparency |
Highly turbid |
Turbid |
Clear |
|
|
Secchi disc depth (m) |
< 0.2 |
0.2 – 0.8 |
> 0.8 |
- Even where the first four variables may be indicative of a certain trophic status, the fifth variable (transparency) may play a significant role in the develoment of eutrophication symptoms.
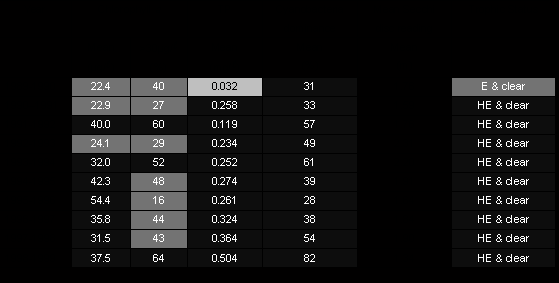
The trophic status of the Roodeplaat Dam was eutrophic in 1989, after which the dam became hyper-eutrophic (Table 2). The mean annual TP concentrations were constantly above the PMO value of 130 µg/l , except for 1989 when TP concentrations were below the PMO threshold value. Of particular concern is the steady increase above the PMO threshold value of the TP concentrations that has occurred since 1991. The mean annual chlorophyll-a concentrations were above the 30 µg/l threshold for hyper-eutrophic systems for most of the period and of all the chlorophyll-a samples, between 29 and 64 per cent were higher than 30 µg/l . The Roodeplaat Dam is thus in serious need of a management strategy to improve the situation, particularly in terms of inorganic, and thus available, nutrients.
Table 2. Trophic status indicators in the Roodeplaat Dam for the period 1989 –1999 (as extracted from Van Ginkel et al. 2000).

O = oligotrophic M = mesotrophic
E = eutrophic HE = hyper-eutrophic