In many cases the management practices required to address nonpoint sources of pollution are well known, but limited resources may preclude their application on a national or even catchment wide basis. In these cases water quality managers need only identify potential nonpoint source problem areas and their relative importance. This does not necessarily require detailed quantitative assessments of nonpoint source contributions, but simply identification of problem areas. Sediment production is one such problem.
Sediment has long been recognised as one of South Africa’s more important water quality problems, and management of erosion forms an important part of water quality management in many areas. The principles of sediment production are well documented, as are appropriate management practices to address the problem. In spite of this sediment remains a significant water quality problem in many areas, most likely due to the fact that limited resources are not focused on the most important sediment production areas.
Unfortunately, most methods of estimating sediment production, such as the Universal Soil Loss Equation (USLE), are focused on small catchments and require fine resolution data inputs. Data at this resolution are often not available for large areas and alternative methods are needed to identify potential problem areas over larger catchments.
A GIS-based approach was developed and tested in the Olifants River catchment to provide a rapid screening and scoping nonpoint source assessment tool. This tool provides the initial information required to focus management efforts within the catchment. The approach is based on qualitatively combining the factors that affect the potential availability of sediment (land cover and soil erodibility) with those that affect the potential washoff of this sediment (slope steepness, rainfall depth and rainfall erosivity). Sediment availability is then linked to washoff potential to identify areas of high, medium and low sediment production potential. Since sediment is a carrier of many of the microbiological indicators, nutrients and toxic materials, the method can be extended to identify and qualitatively rank source areas of these materials.
3.2 Description of the catchment
The Olifants River catchment (Figure 3.1) was chosen to test the method. It has a catchment area of 54570 km2 extending from south of Witbank in Mpumalanga to Phalaborwa in the Northern Province. The rapid siltation of Phalaborwa Barrage requires frequent scouring, resulting in fish kills further downstream in the Kruger National Park. Irrigation farmers in the catchment have also complained of sediment damage to equipment and the deposit of sediment on plant leaves.
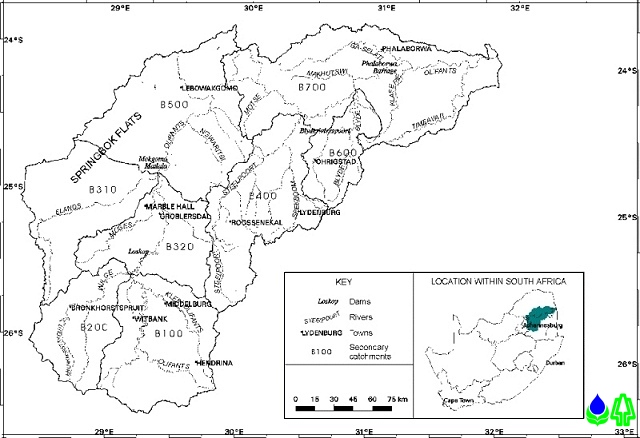
Figure 3.1 Physical description of the Olifants River catchment in South Africa
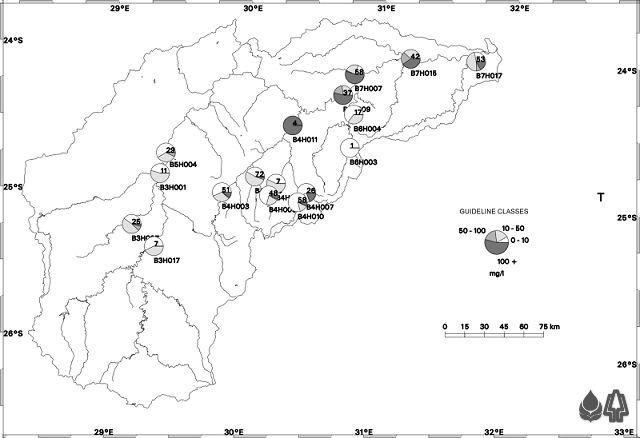
Figure 3.2 Pie symbols showing the frequency with which suspended solid guidelines are met at each point sampled in the Olifants River catchment (the number of suspended solid samples taken at each point is indicated in the centre of each circle.)
Suspended solids data are available for the Olifants River catchment (see Figure 3.2), and are generally better than most other catchments in South Africa. However, even in this catchment sampling has concentrated on certain areas and has not included all the sub-catchments. In addition, sampling frequency has been very low at some points. This makes it difficult to draw conclusions concerning the origin of the sediment problems in the lower Olifants River from observed data. Similarly, there are very little data available to calibrate detailed sediment production models. This lends further support to the need to develop a rapid screening and scoping tool to identify nonpoint sources of sediment.
3.3 The procedure used to model sediment production areas
3.3.1The factors affecting the production of sediment
The displacement of sediment by water depends on the amount and erosivity of the rainfall, slope of the terrain, soil erodibility, and the extent of ground cover. These factors can be further grouped into those that affect:-
- the availability of sediment (i.e. soil erosion hazard and land cover), and
- the washoff of this sediment (i.e. rainfall erosivity , MAP and slopes).
("Washoff" and "Availability" are in fact common to all nonpoint source problems)
Qualitative assessments of these factors can be combined to identify areas of high, medium or low sediment availability and washoff potential. For example steep slopes, combined with high energy rainfall and a high MAP yield a high washoff potential, while erodible soils, poor ground cover and certain land uses yield a high sediment availability. High washoff potential together with high sediment availability in turn identify areas with a high sediment production potential. These factors are all spatial in character, making GIS the perfect platform to combine these data to produce sediment production potential maps. The following paragraphs describe the qualitative assessments used to classify the input data on this basis (Section 3.3.2). The spatial representation of these input data is presented in Section 3.3.3, while the combination of these to produce sediment production potential maps is presented in Section 3.3.4.
Soils
The erodibility of South African soils was evaluated by the previous State Directorate of Agricultural Engineering and Water Supply (Lorentz and Schulze, 1995). These values are published as erosion hazard ratings for all the soil series in South Africa in Schulze (1995). Five erosion hazard classes were identified in these studies:
These five classes were reduced to three classes for this study, depicting low, medium and high soil erosion hazard, as follows :
| Classes | Qualitative soil erosion hazard |
|---|---|
| 1 - 2 | (low) |
| 3 | (med) |
| 4 - 5 | (high) |
Land Cover
Land Cover data, based on Landsat Thematic Mapper satellite data are available for the whole of South Africa at 1:250000 scale. These data provide the most suitable means of spatially identifying the effects of land cover on sediment availability. This was done by assigning a value from 1 to 8 to each of the land use categories identified by the CSIR and ARC (Table 3.1). The classes were based on expert opinion on the effects of land cover types on soil erosion. The 8 classes were further reduced for the Olifants River catchment to three qualitative classes as follows (note: other classes could be used for other catchments depending on the dominant land cover types present)
| Land cover rating |
Qualitative erosion potential |
|---|---|
| 1 - 2 | 1 (low) |
| 3 - 5 | 2 (med) |
| 6 - 8 | 3 (high) |
Table 3.1 Ratings of land cover erosion potential
|
LAND COVER CLASS |
RATING |
|
Cultivated: permanent - commercial dryland |
3 |
|
Cultivated: permanent - commercial irrigated |
2 |
|
Cultivated: temporary - commercial dryland |
3 |
|
Cultivated: temporary - commercial irrigated |
2 |
|
Cultivated: temporary - semi-commercial/subsistence dryland |
6 |
|
Degraded: forest and woodland |
7 |
|
Degraded: thicket & bushland (etc) |
7 |
|
Degraded: unimproved grassland |
7 |
|
Dongas & sheet erosion scars |
8 |
|
Forest |
1 |
|
Forest and Woodland |
2 |
|
Forest plantations |
3 |
|
Herbland |
3 |
|
Improved grassland |
2 |
|
Mines & quarries |
7 |
|
Thicket & bushland (etc) |
4 |
|
Unimproved grassland |
5 |
|
Urban / built-up land: commercial |
3 |
|
Urban / built-up land: industrial / transport |
3 |
|
Urban / built-up land: residential |
3 |
|
Urban / built-up land: residential (small holdings: grassland) |
3 |
Rainfall Erosivity
The erosivity of rainfall can be described using the EI30 value. This is the product of the kinetic energy of a rainfall event and its maximum 30 minute intensity (Smithen and Schulze, 1982). Smithen and Schulze (1982) mapped average EI30 for South Africa, identifying nine EI30 zones in South Africa. Only zones 3 - 9 occur in the Olifants River catchment. These zones are divided into three classes for this catchment as follows (other catchments may require other classes.)
| EI30 zone |
Qualitative rainfall energy class |
|---|---|
| 3 - 5 | 1 (low) |
| 5 - 7 | 2 (med) |
| 7 - 9 | 3 (high) |
Rainfall Amount
A map showing the distribution of mean annual precipitation (MAP) in South Africa is available as part of the 1996 Water Research Commission report on surface water resources of South Africa (Midgely et al, 1996). MAP for individual stations can also be obtained from the Computing Centre for Water Research (CCWR) and interpolation techniques used to derive the spatial distribution in an area. The Department of Water and Sanitation (1986) identified the following three rainfall classes in South Africa:
| MAP | Class |
|---|---|
| < 400 mm | 1 (low) |
| 400 - 800 mm | 2 (med) |
| > 800 mm | 3 (high) |
These classes were adopted for this study. However, other catchments in wetter or drier parts of the country may require other classes.
Slopes
The Department of Land Information, Chief Directorate: Surveys and Mapping has a 400m x 400m resolution Digital Elevation Model (DEM) for the entire country. Elevations at a finer resolution of 200m x 200m, and even 50m x 50m, are available for some parts of South Africa. The 400m x 400m DEM was used to determine slope gradients (as a percentage) in the Olifants River catchment. These percentages were then divided into low, medium and high classes as follows:- (other catchments may be classed differently)
| Slope | Qualitative slope class |
|---|---|
| 0 - 5 | 1 (low) |
| 5 - 25 | 2 (med) |
| 25 - 161 | 3 (high) |
3.3.3 Spatial data inputs for the Olifants catchment
Care was taken to ensure that all the input data were readily available in spatial data form for the whole of South Africa. As such the technique may be readily used on other catchments in the country. The qualitative classes may also be modified to suit local catchment conditions, to provide qualitative assessments of the main sediment production areas relative to that catchment. Similarly, default values may be used to determine sediment production potential relative to the whole country.
The spatial data for the Olifants catchment, after being qualitatively classed as above, were mapped to indicate areas of high, medium and low sediment availability and washoff potential using the methodology outlined in the following section. Figures 3.3-3.7 present the spatial data inputs used.
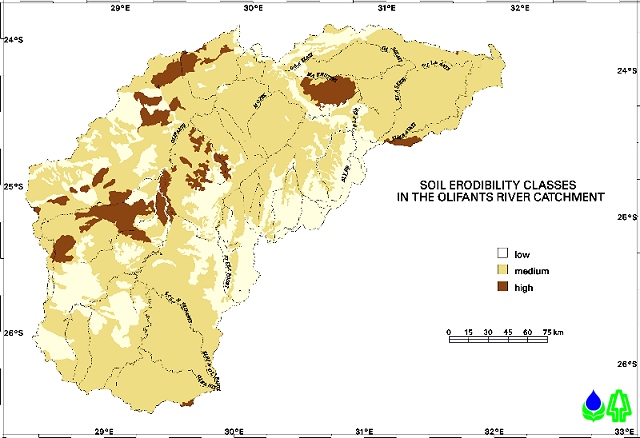
Figure 3.3 Areas of high, medium and low soil erodibility in the Olifants River catchment
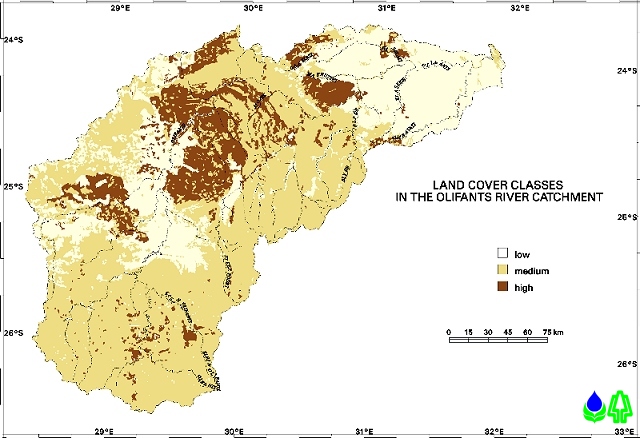
Figure 3.4 Areas of high, medium and low land cover in the Olifants River catchment
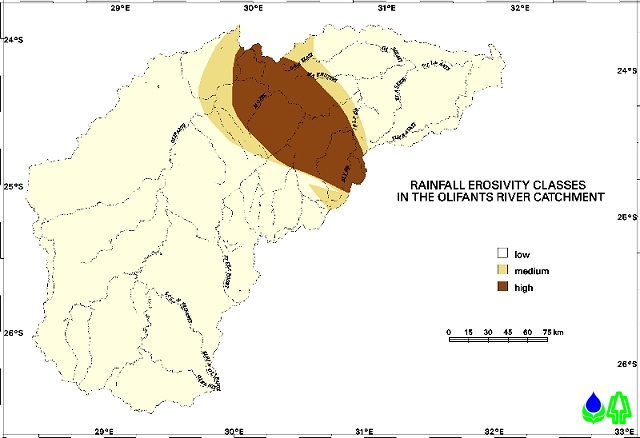
Figure 3.5 Areas of high, medium and low rainfall erosivity in the Olifants River catchment
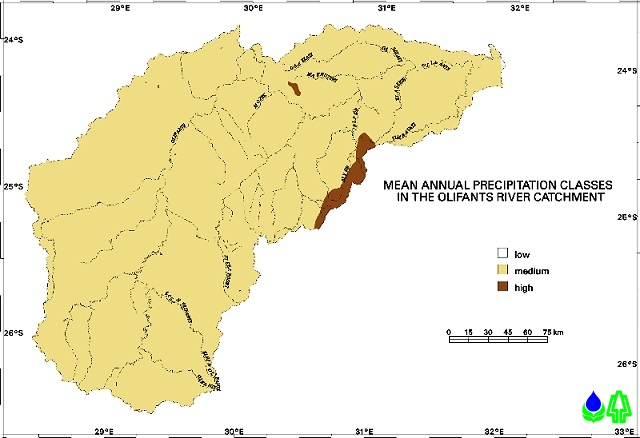
Figure 3.6 Areas of high, medium and low mean annual precipitation in the Olifants River catchment
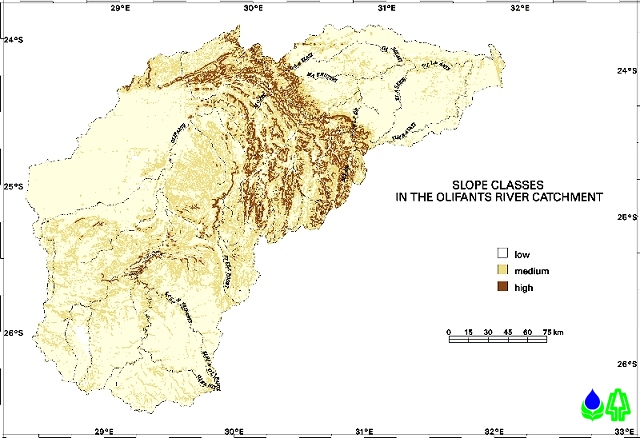
Figure 3.7 Areas of high, medium and low slope steepness in the Olifants River catchment
3.3.4 Combining the qualitative information in matrices
As indicated above, sediment availability depends on a) the type of soil and its erodibility potential, and b) the degree of land cover, while sediment washoff depends on a) the slope steepness, b) the rainfall erosivity, and c) the amount of rainfall. The qualitative classes identified above were therefore combined using the procedure outlined in Figure 3.8, and the matrices outlined in Tables 3.2-3.5.
Table 3.2 shows how the soils and land cover categories are combined to identify sediment availability, and Figure 3.9 presents the resultant sediment availability map.
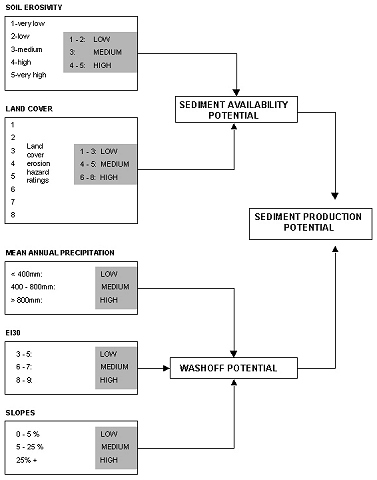
Figure 3.8 A diagram of the process used to combine the factors contributing to sediment production potential
Table 3.2 Sediment availability matrix
| ? | ? | ? | ? | |
| ? | ? |
1 (low) |
2 (med) |
3 (high) |
|
1 (low) |
1 |
2 |
3 |
|
|
2 (med) |
2 |
4 |
6 |
|
|
3 (high) |
3 |
6 |
9 |
Key:
|
low |
medium |
high |
|||
|
1 |
2 |
3 |
4 |
6 |
9 |
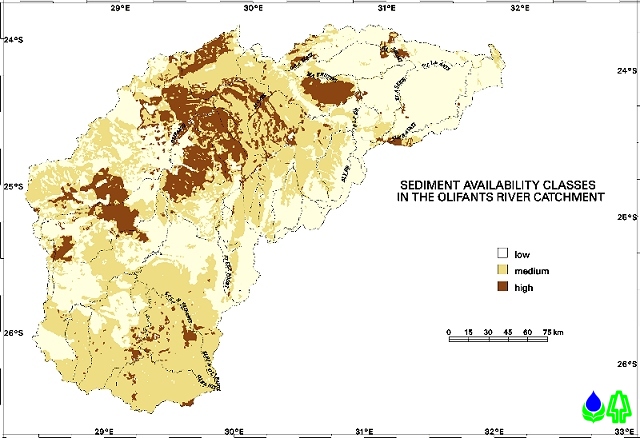
Figure 3.9 Areas of high, medium and low sediment availability in the Olifants River catchment
Table 3.3 shows how the soils and land cover categories are combined to produce washoff potential categories, and Figure 3.10 presents the resultant washoff potential map.
Table 3.3 Washoff matrix
| ? |
MAP |
? |
1(low) |
? | ? |
2(med) |
? | ? |
3(high) |
? |
|
EI30 |
1(low) |
2(med) |
3(high) |
1(low) |
2(med) |
3(high) |
1(low) |
2(med) |
3(high) |
|
| ? |
1(low) |
1 |
2 |
3 |
2 |
4 |
6 |
3 |
6 |
9 |
|
SLOPES |
2(med) |
2 |
4 |
6 |
4 |
8 |
12 |
6 |
12 |
18 |
|
3(high) |
3 |
6 |
9 |
6 |
12 |
18 |
9 |
18 |
27 |
Key:
|
low |
medium |
high |
|||||||||
|
1 |
2 |
3 |
4 |
6 |
8 |
9 |
12 |
18 |
27 |
||
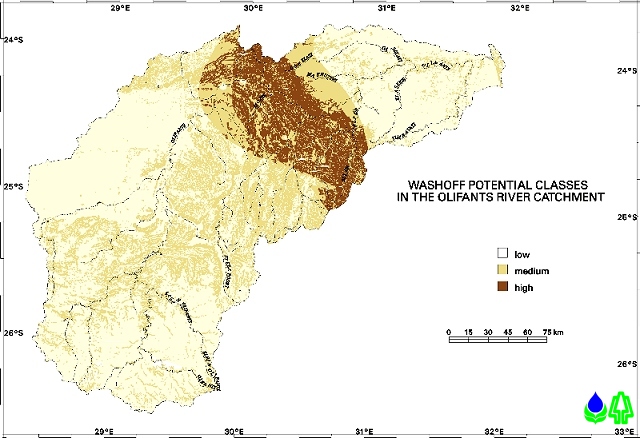
Figure 3.10 Areas of high, medium and low sediment washoff potential
Sediment production potential can then be combined as indicated in Figure 3.8, using the matrix outlined in Table 3.4.
Table 3.4 Table of sediment production potential according to washoff and sediment availability (defaults):
| ? | ? | ? | ? | |
| ? | ? |
1 (low) |
2 (med) |
3 (high) |
|
1 (low) |
1 |
2 |
3 |
|
|
AVAILABILITY |
2 (med) |
2 |
4 |
6 |
| ? |
3 (high) |
3 |
6 |
9 |
Key:
|
low |
medium |
high |
|||
|
1 |
2 |
3 |
4 |
6 |
9 |
However, given that the matrices are based on expert opinion, and are qualitative only, detailed knowledge of the nonpoint source problem and of the catchment in question can be used to refine the procedure. This was done for the Olifants catchment using the following assumptions:
- if washoff potential is high (eg. as a result of steep slopes), but sediment availability is low (eg. as a result of rocky areas), then the erosion potential will be low;
- if the washoff potential is low (eg. as a result of flat slopes), even if the sediment availability is high the overall erosion potential will remain low because the sediment removal is restricted.
These assumptions were used to refine the sediment production potential matrix as outlined in Table 3.5. Any other knowledge of the catchment or nonpoint source problem (for examples for areas where it is known that management practices have been implemented) can be similarly incorporated to focus the technique more on management issues.
The final map of potential sediment production areas in the Olifants Catchment, based on these refinements, is presented in Figure 3.11.
Table 3.5 Final potential sediment production classes
| ? | ? | ? | ? | |
| ? | ? |
1 (low) |
2 (med) |
3 (high) |
|
1 (low) |
low |
low |
low |
|
|
2 (med) |
low |
med |
med |
|
| ? |
3 (high) |
low |
high |
high |
Figure 3.11 closely fits expert knowledge of the eroded areas in the catchment, as well as the sediment production areas which may be inferred from the suspended sediment data which are available. Most importantly it indicates that the densely populated areas, particularly in the lower Steelpoort and Makhutswi catchments show the highest sediment production potential. The latter area is most likely the primary origin of the elevated suspended sediment concentrations noted in the Phalaborwa Barrage and lower Olifants irrigation areas.
Examination of the various input maps also indicates that the sediment problem is mostly associated with the co-incidence of the most densely populated areas (and hence the most degraded veld) being associated with the steeper slopes and more intense rainfall. In the Makhutswi Catchment erodible soils appear to be the most important issue, whereas on the Springbok flats, the impact of the erodible soils is mitigated by the shallow slopes. This would suggest that management attention should be first focused on the densely populated areas of the Makhutswi Catchment, and secondly on the Steelpoort valley. Care should also be taken to avoid further development on the steeper slopes, particularly where erodible soils occur.
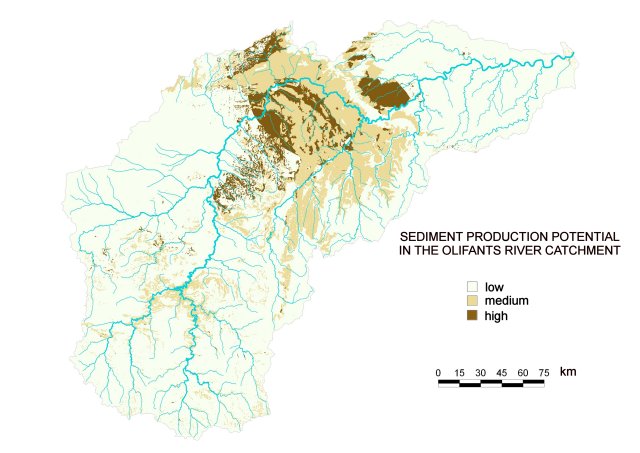
Figure 3.11 Final map showing areas of high, medium and low sediment production potential
3.4 Using the technique for other nonpoint source problems
The concept of overlaying contributing factors to obtain an indication of potential risk can be extended to include other potential nonpoint source problems, using the same basic principle : The potential for the nonpoint source problem is determined by the availability of the pollutant and the availability of water to wash it into nearby water resources (at least for surface water pollution). Since sediment also acts as a carrier of substances such as nutrients (phosphates and nitrates), a potential sediment production map can be combined with a map of land uses categorised according to their low (1), medium (2) or high (3) nutrient availability potential.
The effects of land cover on nutrient availability classification were based on the following generalisations:
- All cultivated land has a high nutrient availability.
- Stable natural vegetation (undisturbed natural vegetation, forest, woodland, thicket & bushland, unimproved grassland) has a low nutrient availability.
- "Forests & plantations" have a medium nutrient availability, due to greater disturbance with extended periods of minimal disturbance (unlike cultivated land).
- Wetlands and Waterbodies are classed as low as they act as nutrient sinks.
- Urban/Built-up land has a high nutrient availability, except where there is a significant portion of grassland (as on smallholdings) which are classed as medium.
- Improved grassland has a medium nutrient availability, because of the likelihood of fertiliser applications and other practices such as harvesting/cutting and grazing which will make nutrients more available.
- Degraded land is increased in value from the original cover class (low to medium, medium to high, etc.), with the exception of degraded unimproved grassland.
- Dongas and sheet erosion are rated as medium because of the uncertainty surrounding as to the adjacent landcover.
These principles were applied to the land cover map, which was then combined with the sediment production map to obtain a map of potential nutrient production (Figure 3.12).
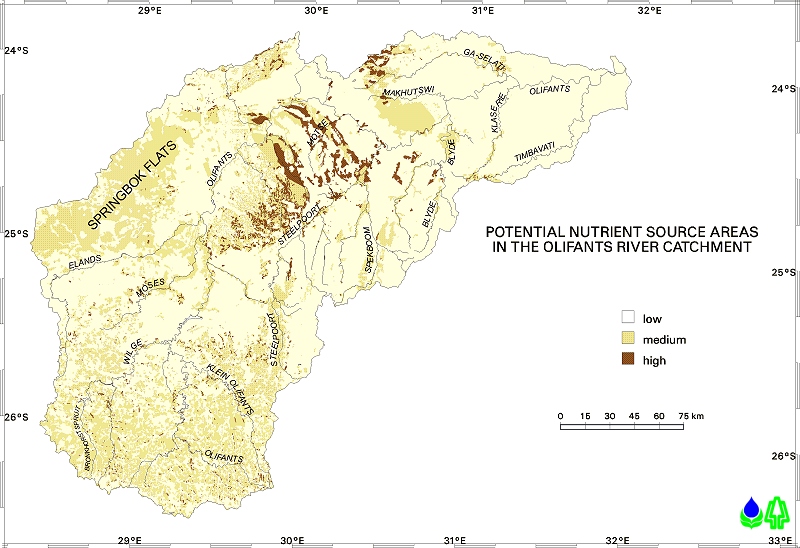
Figure 3.12 Final map showing areas of high, medium and low nutrient production potential
The method presented in this study uses readily available data to provide initial information at a screening/scoping level. It can be used by managers to quickly obtain an indication of the potential nonpoint source production areas in a catchment and expert knowledge of the nonpoint source problem and of the catchment in question can be used to refine the final output. This makes the procedure very flexible, and it can be readily modified to suit a particular management issue. For example a land use which is not considered to be "manageable" (natural sheet erosion) can easily be assigned a zero class. In addition once on GIS the data can be readily further analysed to assess, for example, the land cover classes mostly responsible for the problems, or the sub-catchments with the greatest problems.
The management information produced by this procedure can then form the basis for more detailed studies by focussing attention on the critical nonpoint source areas, or combinations of factors leading to nonpoint source pollution (for example the combination of steep slopes and certain land use types). Similarly, the procedure can readily be modified to address other nonpoint source problems if an understanding of the problem exists.
However, while the model identifies potential production areas, it does not model the production and delivery mechanisms in detail. As such the model can not be used for simulating the likely effects of waste prevention and waste minimisation management practices. In addition, this method does not allow for a quantitative assessment of the nonpoint source contributions from different land uses. It is therefore only suited to a screening and scoping level of assessment, where the manager simply wants to focus on potential nonpoint source production areas. It focuses management attention on the most important land use types, and on the most important areas, typically answering the management question " Where is the nonpoint source pollutant coming from".
Department of Water and Sanitation (1986) Management of the Water Resources of the Republic of South Africa. Department of Water and Sanitation, Pretoria, South Africa
Lorentz, S.A. and R.E. Schulze (1995) Sediment Yield. in R.E Schulze (1995) Hydrology and Agrohydrology: A text to accompany the ACRU 3.00 agrohydrological modelling system. WRC Report, TT69/95. Water Research Commission, Pretoria, South Africa
Midgely D.C., W.V. Pitman and B.J. Middleton (1996) Surface Water Resources of South Africa 1990 - User's Manual. WRC Report number 298/1/94. Water Research Commission, Pretoria, South Africa
Schulze, R.E. (1995) Hydrology and Agrohydrology: A text to accompany the ACRU 3.00 agrohydrological modelling system. WRC Report, TT69/95. Water Research Commission, Pretoria, South Africa
Smithen A.A. and R.E. Schulze (1982) The Spatial Distribution in Southern Africa of Rainfall Erosivity for Use in the Universal Soil loss Equation. Water SA, Vol 8, No 2.