 Throughout this
document, these boxes are inserted to draw your attention to key points.
Throughout this
document, these boxes are inserted to draw your attention to key points.| REPORT NUMBER: | N/A230/01/DEQ0797 |
| PROJECT NUMBER: | MS02/95B |
| STATUS OF REPORT: | Final |
| DATE: | February 1998 |
| Throughout this
document, these boxes are inserted to draw your attention to key points. |
1.1 Background
The Department of Water and Sanitation (DWAF) has long recognised eutrophication as one of the major factors affecting the quality of South African water resources (DWAF, 1986). Eutrophication refers to the enrichment of a water body with plant nutrients, and the symptoms associated with this enrichment (Du Plessis, Bruwer and Howard, 1990). This is a natural process in lake evolution, but may be accelerated by the activities of man. Man-induced eutrophication is referred to as cultural eutrophication, and leads to a progressive deterioration in the quality of the water environment.
A direct result of eutrophication is an increase in the overall productivity of a water body which may include an increase in algae and aquatic macrophyte biomass. This leads to the following more specific water quality problems:
The quality of the water in the Roodeplaat Dam (Figure 1) has long been a cause for concern (Silberbauer, 1982). More recently, however, concerns regarding the water and aesthetic quality of the impoundment led to a request to the Ombudsman that the situation be investigated. In addition to this, Magalies Water have complained about the quality of the water that they receive from the Roodeplaat Dam. The Northern Province Regional Office of the DWAF, therefore, requested that a study be conducted to determine the water quality status of the impoundment, and that the compliance of the Baviaanspoort and the Zeekoegat Water Care Works (WCW)s to the 1 mg.l -1 phosphate standard should be evaluated.
1.2 Eutrophication Management by Means of the Phosphate Standard
World-wide, eutrophication management programmes have concentrated on reducing the total phosphorus load to water bodies (EPA, 1984). The rationale for this approach is that phosphorus is generally considered the most manageable of the nutrients, and there are proven and cost effective technologies for the removal of phosphorus from wastewater. In addition, a significant portion (35 to 50%) of the phosphorus in domestic wastewater, and the majority of the phosphorus in some industrial wastes, is contributed by controllable synthetic detergents (Pillay, 1994).
An effluent standard of 1 mg.l -1 ortho-phosphate (hereafter referred to as the Standard) was, therefore, promulgated on 1st August 1980 by the DWAF as the first step in a long-term eutrophication control programme. The Standard was introduced in seven sensitive catchments throughout South Africa. Local authorities were given five years to upgrade effluent treatment plants in order to comply with the Standard. In 1985, however, local authorities curtailed capital expenditure due to a downturn in the economy and the DWAF was approached for a further extension of the implementation date. The Department decided to grant local authorities exemption from the Standard for a further three years. Therefore, the Standard was only implemented in 1988. The Baviaanspoort WCW should have been complying with the Standard since 1988, and the Zeekoegat WCW since 1992 when it came into operation.
1.3 Objective
The objective of this report is to assess the extent of compliance to the Standard at the Baviaanspoort and the Zeekoegat WCWs, as well as to assess the effect of possible further water quality management scenarios on ameliorating the eutrophication-related water quality problems in the Roodeplaat Dam.
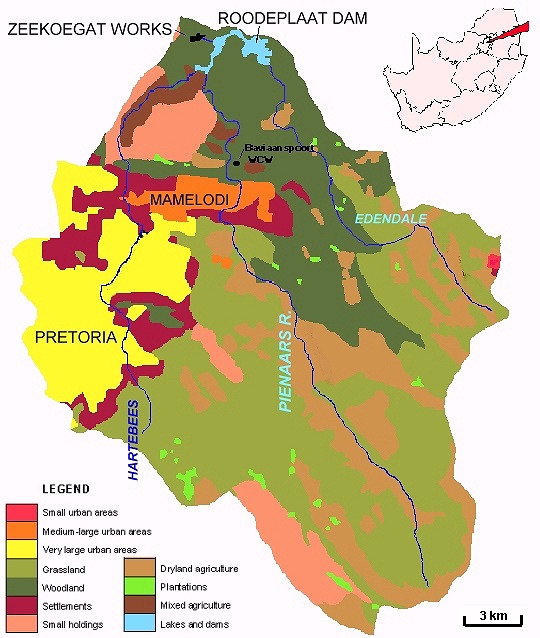 |
| Figure 1 The location of the Roodeplaat Dam and the relevant landuses within the catchment |
2.1 General
Nutrient loads can be described as being either point or non-point source nutrient loads. Point sources are easier to describe and quantify in that they are those that originate from a fixed point such as a water care works. Non-point sources are those that are much more diffuse in origin, such as an irrigated agricultural field, or an informal settlement, where surface washoff will free the nutrients and make them available for transport to the closest water course.
The two main point sources of phosphate contributing to the phosphate load in the Roodeplaat Dam are the Baviaanspoort and the Zeekoegat WCWs. There are also other smaller point sources of nutrients in the catchment, such as various industries and a piggery on the Hartbeesspruit, but data are not available for these and it is likely that their contribution to the total nutrient load to the Roodeplaat Dam is not very significant when compared to the two WCWs. It should be noted, however, that there are significant occurrences of the toxic blue-green bacteria, Microcystis, present in the Hartbeesspruit which would indicate a nutrient source in this tributary to the impoundment (Figure 1).
The Baviaanspoort WCW is located approximately 10 km upstream of the Roodeplaat Dam on the eastern bank of the Pienaars River (Figure 1), and has a 30 Ml .day-1 capacity (Van Zyl and Benadé, 1994). The Zeekoegat WCW is located immediately to the west of the Roodeplaat Dam (Figure 1). The treated effluent flows into the Roodeplaat Dam via a short earth canal which passes through the Roodeplaat Dam Nature Reserve. The Zeekoegat WCW has a present capacity of 34 Ml .day-1, upgradable to 120 Ml .day-1 should the need arise (Van Zyl and Benadé, 1994). An important reason for the Zeekoegat WCW being constructed in the Roodeplaat Dam catchment is that the DWAF had specifically requested that the treated water from the Zeekoegat WCW remain in the catchment due to expected increases in the water demand from this impoundment. During the planning phase of the Zeekoegat WCW it was specified that the WCW outflow would have to meet the Special Standard for phosphate, as promulgated in the Water Act (Act 54 of 1956) as amended in 1984.
2.2 Calculation of Phosphate Loads
Phosphate loads to the Roodeplaat Dam were calculated by multiplying the phosphate concentrations recorded in the inflowing rivers, and WCWs outflows, by their flow rates (Table 1). In most cases the flow record was more complete and more frequently sampled than the concentration record. Concentration data in the rivers was typically sampled weekly, with daily flow being available. Concentration data at the WCWs was recorded at a range of frequencies, from readings taken every two weeks to hourly readings averaged over a day. In order to fill in the missing concentration data, the FLUX model was used. This model makes use of occurrences in the data record where there are concentration and flow data available for the same day. A relationship is calculated which may then be used to predict nutrient concentrations on those days when chemical samples were not taken, but where flow data are available.
In the case of the Baviaanspoort WCW, there are water quality sampling sites both upstream and downstream of the outflow, as well as data from the WCW itself. This enabled the calculation of the contribution of the WCW to the phosphate load, and the estimation of the phosphate loss from solution which takes place between the Baviaanspoort WCW and the impoundment.
Phosphate is lost from solution due to uptake by plants and adsorption onto the surface of sediment particles. These nutrients are once again made available through the consumption or death of the plants, or in the event of a flood. Owing to the short distance between the Zeekoegat WCW and the Roodeplaat Dam, it was assumed that there was no significant loss of phosphate from the treated effluent discharged from this source prior to it reaching the impoundment.
In terms of phosphate loading to the reservoir, three distinct periods are of concern.
PERIOD A: Prior to the introduction of the Standard in 1988, the point source contribution to the total phosphorus load in the impoundment was slightly greater than the non-point source contribution (Table 1 and Figure 2, top pie diagram). During this period, the Baviaanspoort WCW contributed the bulk of the point source phosphorus load, with non-point sources in the Pienaars River contributing more than a quarter of the total phosphorus load (Figure 2, top pie diagram).
PERIOD B: This situation changed slightly after the implementation of the Standard, with the Baviaanspoort WCW contributing half of the total phosphorus load. However, the non-point source contribution of the Pienaars River to the impoundment increased significantly (Figure 2, middle pie diagram), as a result of an increase in activities in the catchment. The total load from the Baviaanspoort WCW reflects a decrease during this period in response to the implementation of the Standard.
PERIOD C: The Zeekoegat WCW came on-line in late 1991. Data from 1992 to 1995 indicated that the Baviaanspoort and the Zeekoegat WCWs jointly contributed more than two thirds of the phosphorus load to the impoundment, with the non-point sources in the Pienaars River contributing about 30% of the phosphate load (Figure 2, bottom pie diagram). The load from the Zeekoegat WCW is almost twice that of the Baviaanspoort WCW due mostly to higher phosphate concentrations in the discharged effluent, flow from the two WCWs being similar. It can be seen that the load from the rivers has increased progressively, while there has been a decrease in the load originating from the Baviaanspoort WCW (Table 1). Total loads are increasing, with an 83 % increase in phosphate load from the 1988 to 1991 period to the 1992 to 1995 period.
| Table 1 Flow, total phosphate load, and phosphorus concentration contributions by the Baviaanspoort WCW, the combination of the rivers (non-point sources), and the Zeekoegat WCW |
|
Nutrient Source |
Flow
|
P Load
|
P Concentration
|
||||||
|
'80-'87 |
'88-'91 |
'92-'95 |
'80-'87 |
'88-'91 |
'92-'95 |
'80-'87 |
'88-'91 |
'92-'95 |
|
|
Baviaanspoort WCW |
4.5 |
7.7 |
11.1 |
16.4 |
14.8 |
13.7 |
3.64 |
1.93 |
1.2 |
|
Non-Point Sources |
16.0 |
21.1 |
11.1 |
12.6 |
15.0 |
16.4 |
0.51 |
0.63 |
1.38 |
|
Zeekoegat WCW |
- |
- |
11.5 |
- |
- |
24.5 |
- |
- |
2.12 |
|
| Figure 2 Relative and mean annual phosphate loads to the Roodeplaat Dam for Period A (prior to the Standard), Period B (prior to the construction of the Zeekoegat WCW, but after the imposition of the Standard), and Period C (after the construction of the Zeekoegat WCW) |
2.3 Summary
Prior to the imposition of the Standard and prior to the construction of the Zeekoegat WCW, it can be seen that there was an approximately 50:50 relationship between point and non-point sources of phosphorus to the impoundment. The impact of the construction of the Zeekoegat WCW on the nutrient load to the Roodeplaat Dam was marked, with the point to non-point source nutrient load ratio changing to 70:30. Although there has been a noticeable increase in the non-point source contribution to the phosphorus load, the magnitude of the increase is far less than that of the increase in the point source load. It is clear, therefore, that the phosphorus load to the Roodeplaat Dam is currently point source dominated, and that this source is likely to become increasingly significant.
Any rehabilitation programme will have to focus primarily on the management of the two point sources.
|
|
|
3.1 Compliance to the Standard by the Point Source Contributors
Since both the Baviaanspoort and the Zeekoegat WCWs are legally required to comply to the Standard (Water Act 54 of 1956, as amended in 1984), this section investigates the extent to which compliance to the Standard has been achieved. In the case of the Baviaanspoort WCW, the date from which compliance should have taken place is August 1988. Since the Zeekoegat WCW was constructed after this date, compliance should have been achieved from the commencement of operation of the WCW.
3.2 Compliance by the Baviaanspoort Water Care Works
Prior to the imposition of the Standard (Figure 3), no noticeable attempt at controlling the phosphate concentration in the treated effluent was evident. Over this period (1980 to 1987), the phosphate concentration of 95 % of the water samples taken at the outflow of the WCW exceeded 1 mg.l -1. Furthermore, it was found that the phosphate concentration of 52 % of the samples exceeded 5 mg.l -1, and 19 % exceeded 10 mg.l -1.
|
| Figure 3 Exceedence diagram for phosphate from the Baviaanspoort WCW, before implementation of the Standard (1980 until the end of 1987) |
After the imposition of the Standard in 1988, 50 % of the samples still exceeded a phosphate concentration of 1 mg.l -1. Higher concentrations were exceeded less frequently (Figure 4).
|
| Figure 4 Exceedence diagram for phosphate from the Baviaanspoort WCW, after implementation of the Standard (1988 until the end of February 1995) |
3.3 Compliance by the Zeekoegat Water Care Works
The exceedence diagram for the Zeekoegat WCW indicates that the Zeekoegat WCW has not been complying with the Standard, with 77 % of the water samples exceeding a phosphate concentration of 1 mg.l -1 from 1992 to 1995 (Figure 5). In 8.5 % and 3 % of the samples, the 5 and 10 mg.l -1 phosphate concentrations were exceeded, respectively. However, it is evident that an attempt has been made at reducing the phosphate concentrations.
|
| Figure 5 Exceedence diagram for phosphate from the Zeekoegat WCW, with the Standard in place (1992 until February 1995) |
A large number of problems were experienced in the early operational phases at the Zeekoegat WCW, largely of a mechanical nature. These problems included aerator and mixer failure in the biological reactors. There were also technical difficulties associated with the chlorine and ferric-chloride (FeCl3) dosing equipment and pumps (De Waal, 1993). However, in recent years, high phosphorus concentrations in the discharged effluent were still recorded.
3.4 Summary
By law, both the Baviaanspoort and the Zeekoegat WCW must comply to the Standard. The Baviaanspoort WCW has shown a reduction in the phosphate concentration in the treated effluent that it discharges to the Pienaars River following the imposition of the Standard. The level of compliance to the Standard is, however, not sufficient. The extent of the exceedence of the Standard of the treated effluent discharged from the Zeekoegat WCW is too high considering that the WCW was constructed after the imposition of the Standard.
|
|
|
4.1 Introduction
It has already been shown that there is a significant point source dominance of the nutrient loading to the Roodeplaat Dam. This is partially due to a lack in adequate compliance to the Standard and a high flow rate from the two WCWs. Furthermore, the volume of treated effluent is expected to increase in the future due to population growth. In attempting to assess the possible future impacts on the impoundment, only increases in point sources were considered since there is even greater uncertainty in predicting non-point source nutrient loads. Non-point source loads were assumed to remain constant for the purpose of these predictions.
4.2 Approach Taken
Based on the expected increased future flows from the Baviaanspoort and the Zeekoegat WCWs (De Waal, 1995), the loads from the WCWs and the catchment were projected 15 years into the future. For the purposes of this study, the flow from the greater catchment was assumed to stay approximately what it was over the last two years of the observed record, that is, a conservative approach was taken. For the baseline projection, the phosphate concentrations from the catchment for the most recent two years of observed record were extended into the future.
Records of observed demands from the impoundment were projected into the future in consultation with Vogel and Sinha (1995). The trend in demands evident over the last two years of the observed record was superimposed over the projected increases to obtain the estimated total projected water demands from the impoundment. These estimated demands were used in all of the scenarios.
Calculation of the in-lake phosphorus concentrations, and the effects that these would have on the algal population, is complicated by the non-conservative nature of both of these variables. Phosphorus entering a water body is adsorbed onto suspended sediments and flocculates out of the water column, furthermore, it may also be released from bottom sediments under anaerobic conditions. Phosphorus is taken up by algae during their growth and is released once they are consumed, or upon their death and decay. The relationship between the chlorophyll a, the main photosynthetic pigment in algae, and phosphate may also change with different species, as well as over time (Van der Merwe and Quibell, 1993).
The in-dam phosphorus concentration at any one time can be calculated as the inflowing phosphorus load, minus the outflowing phosphorus load, minus a lumped parameter which takes into account the phosphorus lost from solution due to sedimentation (Van der Merwe and Quibell, 1993).
4.3 Verification of the Water Balance
Verification of the in-dam phosphorus model is demonstrated by graphs of the observed versus simulated reservoir volume (Figure 6), and in-dam total phosphorus (Figure 7). It can be seen that there is good simulation of the water balance, with only a slight over-prediction of the reservoir volume (Figure 6). The over-prediction of simulated total phosphorus at low concentrations (Figure 7) is possibly due to changing sedimentation characteristics. The effect of the Zeekoegat WCW is, however, accurately simulated.
|
| Figure 6 Calculated versus observed volume in the Roodeplaat Dam |
|
| Figure 7 Observed versus simulated in-dam total phosphorus |

|
|
4.4 Use of the Model for Assessments
Various scenarios were considered for the projections into the future. The scenarios presented below are limited to possibilities involving modifications to the phosphate concentrations being discharged from the WCWs. The baseline report on the Roodeplaat Dam catchment management plan (in preparation) presents scenarios, in addition to those below, which consider the potential effects of various management options such as downstream discharging of the Zeekoegat WCW?s treated effluent.
4.4.1 Scenario a: Maintenance of present concentrations - the "do nothing" scenario
The scenario in which present concentrations are maintained required that the most recent two years of concentration data were projected into future, while at the same time taking into account the increased flows from the WCWs and increased demands from the reservoir (Figure 8). If no management actions are undertaken to limit the nutrient loading to the impoundment, the eutrophication problems being experienced currently can be expected to increase.
|
| Figure 8 Smoothed total phosphorus concentrations in the Roodeplaat Dam under present projected conditions (Scenario a) |
Under these conditions, predicted average total phosphorus concentrations were high. They could be expected to change from an average of 350 ?g.l -1 in 1994 to 200 ?g.l -1 in 1999, to 450 ?g.l -1 in 2010.
This would result in extreme nuisance condition eutrophication, which would render this option as being totally unacceptable.
4.4.2 Scenario b: Effects of the 1 mg.l -1 phosphate standard
If strict compliance to the Standard was enforced, there would be an improvement in the total phosphorus levels in the impoundment. However, since the flow volumes can be expected to continue to increase, by the year 2010 the total phosphorus levels would once again be unacceptably high (Figure 9).
|
| Figure 9 Smoothed total phosphorus in the Roodeplaat Dam under present projected conditions (Scenario a) and the 1 mg.l -1 phosphate standard (Scenario b) |
This imposition of the 1 mg.l -1 Standard would result in a considerable decrease in the average total phosphorus concentration in the Roodeplaat Dam. Under these conditions predicted average total phosphorus concentrations could be expected to decrease from an average of 350 ?g.l -1 in 1994 to 155 ?g.l -1 in 1999, and increase to 320 ?g.l -1 in 2010.
Although scenario b represents a significant improvement over scenario a, it is quite clear that severe nuisance eutrophication conditions will be experienced in the Roodeplaat Dam. This scenario is therefore, in the long term, not the answer for the eutrophication problems of this reservoir. Stricter phosphate control standards should, therefore, be investigated.
4.4.3 Scenario c: Effects of a 0.5 mg.l -1 phosphate standard
The potential effect of the stringent imposition of a 0.5 mg.l -1 standard was assessed in order to determine the potential effect of the availability of more advanced treatment technology making this an attainable reality in the near future (Figure 10). The prognosis is that a 0.5 mg.l -1 phosphate standard will have a considerably beneficial effect on the impoundment?s water quality. Under these conditions predicted average total phosphorus concentrations could be expected to decrease from an average of 350 ?g.l -1 in 1994 to 100 ?g.l -1 in 1999, and increase to 175 ?g.l -1 in 2010. It can be seen that this option holds a lot of promise for the future of the Roodeplaat Dam.
|
| Figure 10 Smoothed total phosphorus in the Roodeplaat Dam under present projected conditions (scenario a) and a possible 0.5 mg.l -1 phosphate standard (scenario c) |
|
|
|
5.1 Compliance to the Standard
The Baviaanspoort and the Zeekoegat WCWs are not complying with the Standard. The Baviaanspoort WCW has shown a decrease in the phosphate concentrations in the treated effluent following the imposition of the Standard, however, 50 % of the samples still exceed the Standard. The Zeekoegat WCW shows an even greater exceedence of the Standard.
5.2 Point and Non-Point Source Contributions
Prior to the imposition of the Standard, and prior to the construction of the Zeekoegat WCW, there was a 50:50 relationship between the point and non-point source contributions to the phosphorus loads to the impoundment. Following the construction of the Zeekoegat WCW this changed to a 70:30 relationship. This is a cause for concern, especially taking into account that the magnitude of the discharges from point sources can be expected to increase in the future.
The non-point source phosphate load is increasing. Growing informal residential areas appear to be the main cause for the increase.
5.3 Phosphate Load Reduction
The catchment is strongly point source dominated. This source of nutrients will, due to increases in flow, become more and more significant, and warrants urgent attention.
The stringent implementation of the 1 mg.l -1 Standard will realise an improvement on the current situation, however, the impoundment?s internal load may prolong the effects of the past loads. Taking into account the projected increased flows from the WCWs, a more stringent phosphate standard will be necessary to bring about an improvement in the longer term.
De Waal, D.J. (1993). Verslag rakende die konstruksie van die Zeekoegat waterversorgingswerke, die rol van die Departement Waterwese daarin en die probleme wat ondervind is na die amptelike ingebruikneming van die werke. Stadsraad van Pretoria, Departement Water en Omgewing, Afdeling Riolering.
De Waal, D.J. (1995). Daspoort Water Care Works. City Council of Pretoria. Personal communication.
Du Plessis, B.J., Bruwer, C.A., and Howard, M.R. (1990). Eutrophication: The trophic status of selected South African reservoirs. Department of Water and Sanitation. Report No. N3/0704.
DWAF (1986). Management of the Water Resources of the Republic of South Africa. Department of Water and Sanitation. Chapter 4.1. ISBN 0 621 11004 3.
EPA (1984). Technical Guidance Manual for Performing Waste Load Allocations. Book IV: Lakes and Impoundments, Chapter 2: Nutrient/Eutrophication Impacts. United States Environmental Protection Agency. Report No. EPA 440/4-84-019.
Pillay, M. (1994). Detergent Phosphorus in South Africa: Impact on Eutrophication with Specific Reference to the Umgeni Catchment. M.Sc.Engineering dissertation, Department of Chemical Engineering, University of Natal, Durban.
Silberbauer, M.J. (1982). The effect of a proposed sewage works in the Moreleta Spruit catchment on the phosphate and nitrate loading to Roodeplaat Dam. Hydrological Research Institute, Department of Water and Sanitation. Report number B33/2/123/7.
Van der Merwe, B. and Quibell, G. (1993). The Impact of Phosphorus Load Reduction on Eutrophication Related Water Quality in the Klipfontein Dam. Hydrological Research Institute, Department of Water and Sanitation. Draft Report No. N/W200/DPQ/2493.
Van Zyl en Benadé (1994). Substreekstruktuurplan vir die Roodeplaatdam gebied vir die Pretoria Streekdiensteraad. Van Zyl en Benadé Stads- en Streekbeplanners.
Vogel, S.C. and Sinha, P.K. (1995). Project Planning Division: Department of Water and Sanitation. Personal communication.