 Things look bad, but this map is just a snapshot in time.
Is sulphate a new problem? Is it getting worse?
Things look bad, but this map is just a snapshot in time.
Is sulphate a new problem? Is it getting worse?
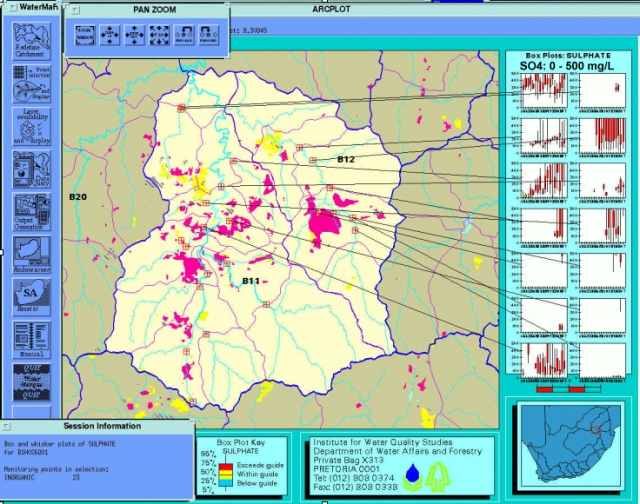
We choose to plot bar graphs of the annual median and inter-quartile distribution of sulphate concentrations for the previous fifteen years. The maximum on the sulphate axis is 500 milligrams per litre. Sensitive industries can only tolerate 30 milligrams per litre in their water. Most of these sites do not meet this criterion, and have not for at least a decade.
Please send comments on these pages to Michael Silberbauer at the Institute for Water Quality Studies.
[ Back to Index Page ]