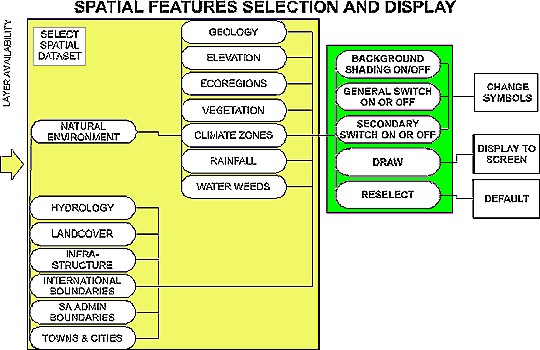
To display additional geographical features on your catchment map, use this module. Each of the menus belonging to this module is structured similarly. All menus in this Spatial Feature Selection display module contain two general selection switches which, if inactivated, limit the display of the layers in some way.
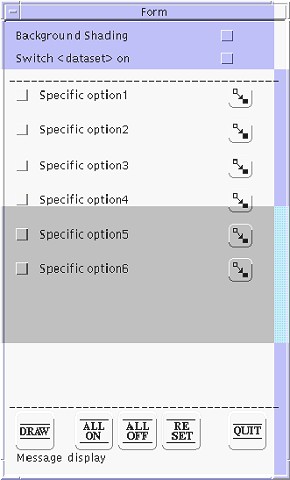
3a A model menu of the Spatial Feature Selection Module
The first general selection switch on the menu is the background shading switch. It is activated and deactivated by clicking the mouse pointer over the check box situated immediately below the menu title. This switch controls and determines the extent to which the layers chosen are displayed; either all over the display area (not activated) or only to the catchment which you have selected in the Catchment Selection module (activated).
The second general selection switches determine whether or not any of the selections you will make via the specific control switches will be displayed on the screen.
At the base of the module's menus are five icons:
![]() The number of polygon datasets
that can be plotted at once is limited. Complete solid fill
coverages such as rainfall or landuse obscure background
information so only one such layer can be plotted.
The number of polygon datasets
that can be plotted at once is limited. Complete solid fill
coverages such as rainfall or landuse obscure background
information so only one such layer can be plotted.
Exceptions to this rule include Dams and Urban areas, which can be displayed on top of other layers. The program will automatically place them on top of all other polygon data, whatever the order of selection.

Adding background geographical features to the map areas allows easy recognition of the area. This allows potential impacts on water quality by environmental phenomena to be identified and considered. As the purpose of WaterMarque is to monitor the water quality in South Africa, we will start by selecting hydrological features. Note that you can access the layers either before or after selecting the catchment or monitoring points, depending on your requirements.
In this manual the layers that are accessible directly from this menu are discussed first. Should you click on the Natural Environment icon on the Geographical Featuresmenu, the Natural Environment menu will appear and provide you with a further selection of layers.
![]() Click on the Hydrology icon on
the Geographical Features menu. The Hydrological
Features Selection menu appears onscreen.
Click on the Hydrology icon on
the Geographical Features menu. The Hydrological
Features Selection menu appears onscreen.
There are two main hydrological features datasets:
Commonly, rivers are shown on maps as linear features. In this manual the rivers you can display to screen are drawn from two different data sets. Of these the more useful is the SA Hydrological Features menu which allows you to select layers with a scale of 1: 500 000 as opposed to the 1: 1 000 000 DCW. The 1:500 000 river arcs have Strahler order.
To use the SA Hydrological features, click on the check box after the SA Hydrological features option. Then click on those features that you wish to select in that sub-directory:
To select rivers, click on the check box after DCW features, and a tick will appear in the relevant check box. To display International rivers to the screen or map, click on the check box to the left of the International rivers option on the menu.
![]() Should you want
all the rivers, streams and dams in a uniform colour, use the
icons in front of the symbols. Click on the appropriate icon.
A change symbols popup menu appears. Use the scrollbar to
scroll down through the colours until you find a suitable one,
then click on the colour you want to use. The colour of the
representative symbol will appear in the new colour. Simply click
on the Reset icon in the lower portion of the menu and the
default colours will reappear.
Should you want
all the rivers, streams and dams in a uniform colour, use the
icons in front of the symbols. Click on the appropriate icon.
A change symbols popup menu appears. Use the scrollbar to
scroll down through the colours until you find a suitable one,
then click on the colour you want to use. The colour of the
representative symbol will appear in the new colour. Simply click
on the Reset icon in the lower portion of the menu and the
default colours will reappear.
When you have made your selection of the available options click on the Draw icon at the bottom of the menu.
When you are satisfied with the map, click on the Quit icon.
![]() If you do not wish
to slow your session down every time you redraw your screen,
activate this general control switch only in your output
module.
If you do not wish
to slow your session down every time you redraw your screen,
activate this general control switch only in your output
module.
![]() Click on the Landcover icon in
the Geographic Features menu. Should the Geographical
Features menu not be on screen, activate it from the
Main menubar and the Geographical Features
menu.
Click on the Landcover icon in
the Geographic Features menu. Should the Geographical
Features menu not be on screen, activate it from the
Main menubar and the Geographical Features
menu.
The Landcover menu appears.
Click on the check box to the right of the Switch landuse on option.
Click on the check boxes to the left of the options you select.
Once you have selected the landcover you wish to display, click on the Draw icon to present them to screen.
![]() If you do not wish
to slow your session down every you redraw your screen, activate
this general control switch only in your output module.
If you do not wish
to slow your session down every you redraw your screen, activate
this general control switch only in your output module.
![]() Click on the Infrastructure icon
on the Geographical Features menu. Should the
Geographical Features menu not be on screen, activate
it from the Main menubar and the Geographical
Features menu. Click on the Infrastructure icon.
Click on the Infrastructure icon
on the Geographical Features menu. Should the
Geographical Features menu not be on screen, activate
it from the Main menubar and the Geographical
Features menu. Click on the Infrastructure icon.
The four main options are:
To select all of the sub-directory options click on the check box following the main option. For example, if you click on the box following Roads, all four types of roads will be selected as shown by the ticks which appear in the check boxes in front of them, tracks, trails and footpaths included.
If tracks, trails and footpaths are not of interest and only clutter up your map, switch off this option by clicking on the tick on the box in front of it. The tick will disappear and this option will not appear on the map.
Select the features you want to appear on the map.
Click on the check box following the Bridges option, should you want to have bridges indicated on your map. If not, ignore this option.
Click on the check box to the right of the Roads option, only if you want to include all the road options. Otherwise click on the check boxes of the more significant road options such as dual lane highways and primary and secondary roads.
Click on the check box to the right of the Railways option if you want to include all the available railway options including light duty and urban area connectors. If you want to indicate only the larger, more important railway lines, click on the check boxes in front of the Multiple track and Single track options.
Click on the check box to the right of the Utility line option if you want to indicate all the Utility line options on your map. If not, ignore the main Utility lines option and click on the check boxes to the right of each option you select.
![]() Click on the Political Boundaries
icon on the Geographical Features menu. Should the
Geographical Features menu not be on screen, activate
it from the Main menubar and the Geographical
Features menu. Click on the Political Boundaries
icon.
Click on the Political Boundaries
icon on the Geographical Features menu. Should the
Geographical Features menu not be on screen, activate
it from the Main menubar and the Geographical
Features menu. Click on the Political Boundaries
icon.
The Southern African Countries menu will appear in the upper right-hand corner of the screen.
This is one occasion where the Background shading option is useful, so start by clicking on the check box after this option.
Click on the check box after the Switch countries on option.
![]() Here you do not
have the option of choosing the countries individually. You do
however have the option to change the colours in which the
countries are shaded. To make the states you do not wish to
display invisible, and maintain those that are required, use the
change symbol icon and the popup menu to shade the
unnecessary states the same colour as the ocean or your
background.
Here you do not
have the option of choosing the countries individually. You do
however have the option to change the colours in which the
countries are shaded. To make the states you do not wish to
display invisible, and maintain those that are required, use the
change symbol icon and the popup menu to shade the
unnecessary states the same colour as the ocean or your
background.
Click on the Draw icon. When you are finished, click on the Quit icon at the base of the menu.
![]() Click on the Towns and cities
icon on the Geographical Features menu. You can activate
the Geographical Features menu through the Main
menu bar.
Click on the Towns and cities
icon on the Geographical Features menu. You can activate
the Geographical Features menu through the Main
menu bar.
The Urban Areas menu will appear in the upper right-hand corner of the screen.
The menu contains the following selections:
Urban Points: Location.
This option allows you to select between:
This selection is derived from the DCW data and is not suited for the viewing of data over the whole country. It is best suited to viewing in the localised catchments, as it is highly detailed. The major cities can be viewed at any scale.
Urban Points: Annotation
The minor cities option provides annotation of city and town names to the points on the display in the Urban Points location selection. Again the minor cities are best selected after one has selected and zoomed into a catchment.
Urban Areas:
This option allows you to select urban settlement polygon data. This shades the land area covered by urban settlement. It can be used together with the point annotation option, or, each polygon can be individually annotated if you chose annotation with urban areas.
![]() You can indicate
the position of a feature by clicking on the check box to the
right of the Location option. If you want to name the
feature click also on the check box to the right of the
Annotation (name!) option.
You can indicate
the position of a feature by clicking on the check box to the
right of the Location option. If you want to name the
feature click also on the check box to the right of the
Annotation (name!) option.
![]() It is better to
use rather too few landmarks than too many and to name only those
provinces, towns, cities and landmarks that are important to
orientating the map user. The final map size will also influence
the number of features that can be easily seen on a map.
It is better to
use rather too few landmarks than too many and to name only those
provinces, towns, cities and landmarks that are important to
orientating the map user. The final map size will also influence
the number of features that can be easily seen on a map.
When you have selected the options you wish to see on your map, click on the Draw icon at the base of the menu.
When you are satisfied with your choices, click on the Quit icon at the base of the menu.
![]() If you do not wish
to slow down your session every time you redraw your screen,
activate the general control switch only in your output
module.
If you do not wish
to slow down your session every time you redraw your screen,
activate the general control switch only in your output
module.
![]() To add administrative boundaries to the
map click on the Administrative Boundaries icon on the
Geographical Features menu. Should the Geographical
Features menu not be onscreen, activate it through the
Main menubar. Click on the Administrative
Boundaries icon.
To add administrative boundaries to the
map click on the Administrative Boundaries icon on the
Geographical Features menu. Should the Geographical
Features menu not be onscreen, activate it through the
Main menubar. Click on the Administrative
Boundaries icon.
The menu is divided into two main sections :
![]()
The Location Facility is fully functional. But you can only name the South African provinces using the Annotation facility and not the farms or magisterial districts. This data may be incorporated into later versions of WaterMarque.

![]() To add natural environment features to
your map, click on the Natural Environment icon on the
Geographical Features menu. Should the Geographical
Features menu not be present, activate it through the
Main menu bar .
To add natural environment features to
your map, click on the Natural Environment icon on the
Geographical Features menu. Should the Geographical
Features menu not be present, activate it through the
Main menu bar .
The Natural Environment menu will appear in the upper right-hand corner of the screen.
The features which are listed and may be chosen to appear on your map include:
![]() Click on the Geology icon in the
Geographical Features menu to activate this menu.
Should it not be present onscreen activate it through the Main
menu bar.
Click on the Geology icon in the
Geographical Features menu to activate this menu.
Should it not be present onscreen activate it through the Main
menu bar.
The Geological groups menu consists of sixteen check boxes. Each check box displays a rock layer or rock type e.g. compact arenaceous and argillaceous strata. These are hydrogeological classifications. The full geology coverage will be available in a later version of WaterMarque.
When you have made your choice, by selecting the secondary control switches relevant to the layers you wish to display, click on the check box at the top of the menu where it says Switch geology on. Then click on Draw icon at the base of the menu.
![]() If you do not wish
to slow your session down every time you redraw your screen,
activate this primary control switch only in your output
module.
If you do not wish
to slow your session down every time you redraw your screen,
activate this primary control switch only in your output
module.
![]()
![]() Click on the Elevation icon on
the Natural Environment menu. This is activated through
the Main menu bar and the Geographical Features
menu. Elevation is displayed and manipulated through the
Hypsographic Features menu. The display selections you have
access to are:
Click on the Elevation icon on
the Natural Environment menu. This is activated through
the Main menu bar and the Geographical Features
menu. Elevation is displayed and manipulated through the
Hypsographic Features menu. The display selections you have
access to are:
Select any or all of these options by clicking on the check boxes in front of the individual options.
Contour lines are linear features joining points of equal heights.
Contour Heights are Point Features which are displayed to the map as points associated with heights given in metres on the screen. Selecting this option is best done after one has zoomed into the catchment one would like to work in as the data is very detailed. The points and numbers associated with this function are not autoscaled.
![]() Elevation is
indicated onscreen by means of shading. The elevation range of
the country is divided into separate bands (0, 200, 400, 1000,
1500, 2000, 3000, 4000 metres above mean sea level) each having
its own colour.
Elevation is
indicated onscreen by means of shading. The elevation range of
the country is divided into separate bands (0, 200, 400, 1000,
1500, 2000, 3000, 4000 metres above mean sea level) each having
its own colour.
![]() To display these to your map click on
the Ecoregions Feature icon on the Natural
Environment menu.
To display these to your map click on
the Ecoregions Feature icon on the Natural
Environment menu.
The Ecoregions menu appears on screen. The 26 Ecoregions are homogenous ecological units having a relatively uniform impact on water resources under pristine conditions. Ecoregions are determined by geology, elevation, rainfall and vegetation. The large number of Ecoregions means that only half the menu appears at a time. Notice the More icon located at the bottom of the menu. This icon enables you to activate the second Ecoregions menu. Similarly on the Final Ecoregions menu there is also a More icon which enables you to activate the First Ecoregions menu.
There are five label options to accompany your choice of ecoregion layers. You can use only one at a time on your map:
The labels will occur as area attributes within each region, naming different areas according to their characteristics.
If you do not wish to slow your session down every time you have to redraw your screen activate this primary control switch only in your output module.
![]() You might find
that the labels you have chosen through the label attributes
section of the menu may not occur within your catchment map. This
is especially likely to occur when the ecoregion is large and
covers many primary catchments. This is not to say that there is
no attribute data to accompany the layer but that it falls
outside the map. To rectify this, zoom out slightly to include
the label in your map presentation.
You might find
that the labels you have chosen through the label attributes
section of the menu may not occur within your catchment map. This
is especially likely to occur when the ecoregion is large and
covers many primary catchments. This is not to say that there is
no attribute data to accompany the layer but that it falls
outside the map. To rectify this, zoom out slightly to include
the label in your map presentation.
You can also overcome this by zooming out using the Zoom Out icon (top right-hand icon on the Panzoom menu) until the label occurs on your map. Click on the Zoom Out icon. Repeat these steps until the label appears.
![]() Click on the Vegetation icon on the
Natural Environment menu. This is activated through the
Main menubar and the Geographical Features menu.
Click on the Vegetation icon on the
Natural Environment menu. This is activated through the
Main menubar and the Geographical Features menu.
The Vegetation Types menu will appear.
The 12 vegetation types listed in the menu are those defined on the 1982 J.P.H. Acocks Veld Types of South Africa map.
The default colours selected to represent the vegetation types are approximately those used by Acocks.
When you have made your selection, click on the Draw icon at the base of the menu. If you are satisfied with the map, click on the Quit icon at the base of the menu. If dissatisfied, select new options and click on Draw once more.
![]() Click on the Climatic Zones icon
on the Natural Environment menu. This is activated
through the Main menubar and the Geographical
Features menu.
Click on the Climatic Zones icon
on the Natural Environment menu. This is activated
through the Main menubar and the Geographical
Features menu.
These zones were developed by the Department Engineering, University of Natal (see copyright section) and include rainfall, slope and aspect. There are 712 Climatic zones in South Africa. None of the climatic data is available in this version of WaterMarque. The zones have, however, been classified into 15 groups: 1-50, 51-100, 101-150,151-200, 201-250, 251-300 and so on to 701-712.
To display the climatic zones on your map, click on the check box following the Display climatic zones option at the top of the menu.
When you have made your selection, click on the Draw icon at the base of the menu. If you are satisfied with the map, click on the Quit icon at the base of the menu. If dissatisfied, select new options and click on Draw once more.
![]() Click on the Rainfall icon on
the Natural Environment menu. This is activated through
the Main menubar and the Geographical Features
menu. The Rainfall menu will appear.
Click on the Rainfall icon on
the Natural Environment menu. This is activated through
the Main menubar and the Geographical Features
menu. The Rainfall menu will appear.
![]() The intervals
chosen here are 100 mm, which may be too coarse for water
monitoring purposes at the catchment scale.
The intervals
chosen here are 100 mm, which may be too coarse for water
monitoring purposes at the catchment scale.
Once again the default colours selected are those that are used as standard indicators of varying rainfall values.
When you have made your selection, by selecting the specific control switches relevant to the layers you wish to display, click on the Draw icon at the base of the menu.
If you are satisfied with the map, click on the Quit icon at the base of the menu. If dissatisfied, select new options and Draw once again.
As water weeds can cause problems in both waterbodies and waterways, a database indicating their presence or absence is being compiled and is included in WaterMarque. The database supplied is a digital copy of a once off survey in 1991. This is now out of date, and not spatially verified.
![]() To include this data on your map, click
on the Water Weeds icon on the Natural environment
menu. The Water weeds menu will appear.
To include this data on your map, click
on the Water Weeds icon on the Natural environment
menu. The Water weeds menu will appear.
The water weeds monitored here include:
The colours representing them on the chart are arbitrary, but the marker symbols represent the actual plants.
When you have made your selection, by selecting the secondary control switches relevant to the layers you wish to display, click on the Draw icon at the base of the menu. If you are satisfied with the map, click on the Quit icon at the base of the menu. If dissatisfied, select new options and click on Draw once more.