RHP South African
River Health Programme
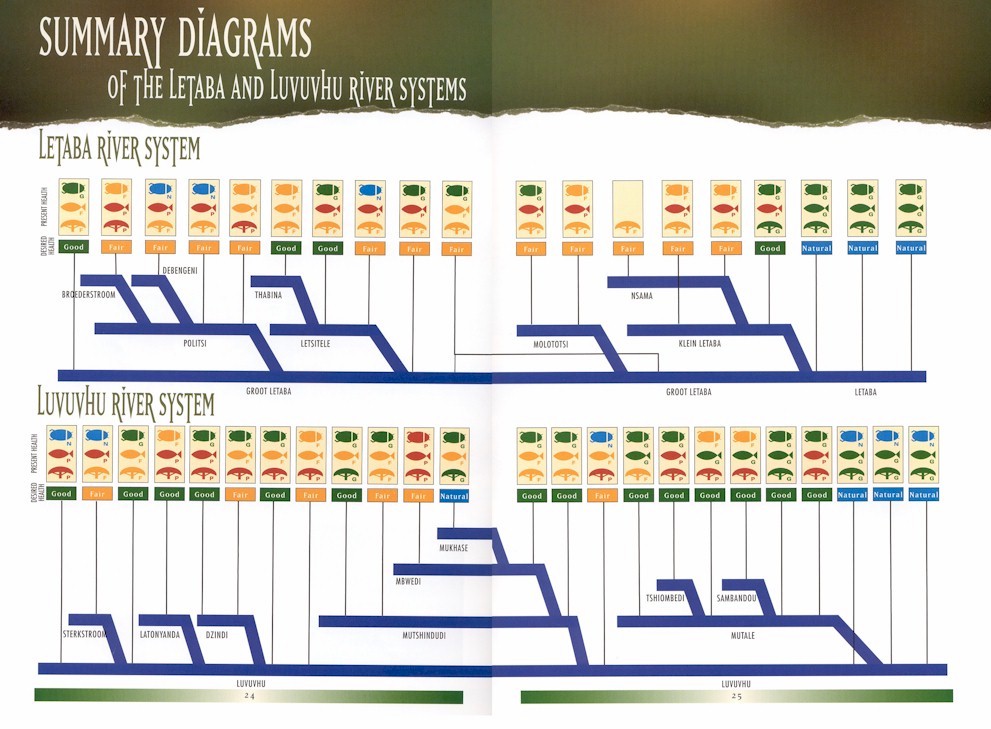
State of the Rivers Report
Letaba & Luvuvhu
River Systems
go back to RHP homepage Table of Contents RHP background, concepts used in this report, overview of study area and ecoregion characteristics (a pdf file) Letaba River System Luvuvhu River System summary diagram glossary reading list species mentioned in report Adaptive Management Cycle
INTRODUCTION TO THE LETABA & LUVUVHU

BACKGROUND

Water resources in South Africa are limited making them critically important for the sustainable economic and social development of the country. As the custodian of water resources, the Department of Water and Sanitation (DWAF) is responsible for the protection of the health of aquatic ecosystems, thus ensuring the ability of these systems to support utilisation for the benefit of current and future generations. For this reason, DWAF initiated the River Health Programme (RHP) in 1994.

The RHP is designed to develop the capacity and information base to enable us to report on the ecological state of our river systems, in an objective and scientifically sound manner. At the same time, this programme audits management strategies and actions related to water resources. The information generated by the RHP assists in identifying areas of sustainable utilisation and unacceptable ecological deterioration.

The programme is based on assessing the condition of biological communities of rivers (such as fish, aquatic invertebrates and riparian vegetation) as well as river habitats to provide an integrated measure of the integrity or health of river systems.

A COLLABORATIVE VENTURE

The RHP is a collaborative venture and the partnerships that have been established are critical success factors of both the design and implementation phases. At the national level, DWAF plays the lead role while the Department of Environmental Affairs and Tourism (DEAT) and the Water Research Commission (WRC) are actively involved. These national partner organisations support not only the development but also the ongoing improvement of the monitoring protocols and implementation procedures that make up the RHP. These protocols and procedures are available to any institution that wants to become involved in river health monitoring.

Implementation of the RHP is co-ordinated at a provincial level where collaboration also plays an important role. Each province has a network of implementers who work together, usually under the leadership of a Provincial Champion. The composition of the implementation teams reflects the diversity of institutional capacities across South Africa. A mixture of DWAF regional offices, provincial government departments, universities, conservation agencies and private sector organisations take part. Through actively working together and sharing skills and resources, implementation teams can achieve goals that would not be possible for any one organisation working alone. As an example, the implementation team of the Northern Province primarily includes river scientists from the Northern Province Environmental Affairs, Kruger National Park, University of Venda and the University of the North.

LEGAL CONTEXT

The RHP is essentially a tool for monitoring the ecological state of rivers in South Africa and is not specifically mandated by any South African act of parliament. However, the results obtained through application of the RHP can invoke certain legal principles contained in the National Environmental Management Act (NEMA) and the National Water Act (NWA), for example where there is irrefutable evidence of environmental degradation or a violation of the conditions specified in a water use licence.

The NWA requires that the DWAF must, amongst other things, ensure the monitoring of the condition of water resources including the health of aquatic ecosystems. The protection objectives of the new act also require that planning processes take into account the characteristics of in-stream and riparian vegetation as well as the characteristics and distribution of aquatic biota.

NEMA is largely concerned with governing the sustainable use of the environment and the protection of ecosystems. To achieve this, it requires information that would show the current ecological state of ecosystems, indicate where actual environmental impacts are occurring, and provide guidance for the planning of future developments.

STATE OF RIVERS (SOR) REPORTING SERIES

The concept of State of the Environment (SoE) reporting has developed over the past decade in response to a need for appropriate information to assist with environmental decision-making. In response to this need, the RHP addresses monitoring, packaging and dissemination of information on river health in such a way as to: a) Serve ecologically sound management of rivers in South Africa and b) Inform and educate the people of South Africa regarding the health and importance of our rivers.

A special format has been developed for reporting the river health information generated by the RHP, in a simplified and summarised SoR report or a SoR poster. The first SoR report was published in March 2001 and presented findings of RHP surveys that were conducted on the Crocodile, Sabie-Sand and Olifants rivers as well as some of their tributaries. The Letaba & Luvuvhu report is the second in the SoR report series and this initiative will continue to eventually cover all major river systems of South Africa.

Fever trees in the Kruger National Park - Andrew Deacon Village in Luvuvhu Catchment - Wilma Strydom

CONCEPTS USED IN THIS REPORT

RIVER HEALTH AS REALTED TO GOODS AND SERVICES

The term "river health" simply refers to the condition of a river, in the same way as health would refer to the condition of a person or an economy. It is important to monitor and manage the health of rivers, as these systems are central to human welfare and economic development in many ways. We can express the social and economic value of rivers in terms of the goods and services provided by these aquatic ecosystems. Some of the goods and services that we get from healthy river systems are:

  • Tourism and recreation value generated by aquatic habitats and species (just think how many tourist lodges overlook water)
  • Enhanced private and commercial property values
  • Food value (for example fish from the river and fruits from the riparian zone)
  • Domestic water value (drinking, cooking, cleaning, washing)
  • Consumptive water value (power generation, manufacturing, aquaculture, irrigation)
  • Medicinal plants which grow in the riparian zone
  • Building materials (reeds, wood, stone, sand)
  • Cultural value (baptism, healing, ancestral worship)
  • Water quality improvement through self purification ability or dilution
  • Flood control value of natural river channels, wetlands and associated vegetation
  • Erosion control of riparian vegetation
  • RIVER HEALTH INDICES

    A multitude of factors determine the health of a river ecosystem: geomorphological characteristics, hydrological and hydraulic regimes, chemical and physical water quality and the nature of in-stream and riparian habitats. Measuring each of these factors in detail is impractical. The RHP therefore focuses on selected ecological indicator groups that are representative of the larger ecosystem and are feasible to measure. Through scientifically derived indices, the complex data that are collected for each indicator group can be summarised and expressed in an easy to understand format. The following indices are currently used to assess the health of rivers:

  • South African Scoring System (SASS) for aquatic invertebrates - A variety of invertebrate organisms (e.g. insect larvae, beetles, mussels, snails, crabs, worms) require specific aquatic habitat types and water quality conditions for at least part of their life cycles. Changes in the composition and structure of aquatic invertebrate communities are signs of changes in overall river conditions. As most invertebrates are relatively short-lived and remain in one area during their aquatic life phase, they are particularly good indicators of localised conditions in a river over the short term. The SASS is a relatively simple index which is based on the families of aquatic invertebrates present at a site. This information is translated into a reflection of the quality of the water in the river.

  • Fish Assemblage Integrity Index (FAII) - Fish, being relatively long-lived and mobile, are good indicators of longer term influences on a river reach and the general habitat conditions within the reach. The number of species of fish that occur in a specific reach, their sensitivity to various forms of disturbances as well as factors such as different size classes and the health of fish, can be used as indicators of river health. The FAII integrates such characteristics of a fish assemblage. The output of the FAII is an expression of the degree to which a fish assemblage deviates from what would have been expected in the absence of human impacts.

  • Riparian Vegetation Index (RVI) - Healthy riparian zones provide habitat for aquatic and terrestrial species, contribute towards maintaining the form of the river channel and serve as filters for sediment, nutrients and light. The structure and function of riparian vegetation are altered with vegetation removal, cultivation, construction, inundation, erosion, sedimentation and alien vegetation invasion within or close to the riparian zone. The RVI is used to determine the degree of modification in riparian conditions.

  • Index of Habitat Integrity (IHI) - Habitat availability and diversity are major determinants of the suite of biota found in a specific ecosystem. Therefore, knowledge of the quality of habitats is very important in an overall assessment of ecosystem health. The IHI is designed to assess the impact of major disturbances on river ecosystems. Such disturbances include water abstraction, flow regulation and river channel modification. The index accounts for both the condition of the riparian zone and in-stream habitats. The IHI has not been conducted in the Letaba and Luvuvhu river systems since 1996 and was therefore not included in this report.
  • ECOREGIONS

    Ecoregions are regions of broad ecological similarity. In other words, rivers that occur within a particular ecoregion will be more similar to each other than to rivers in other ecoregions. Variation in natural characteristics such as physiography, climate, geology, soils and vegetation was used to delineate the ecoregions used in this report. Because of their similarity, these ecoregions provide convenient boundaries within which to do ecological assessments and set quality objectives.

    South Africa has 18 level 1 ecoregions. A decimal value (e.g. 5.03) represents a subdivision to
    level 2.

    RIVER HEALTH CATEGORIES

    The results that are obtained by applying the biological and habitat indices during a river survey provide the context for determining the health state of the river. In order to standardise the output of the different indices as well as to allow comparison of the health of different river systems, a river health categorisation is used. Each index is calibrated so that its results can be expressed as a river health category (see box on page 4).

    RIVER HEALTH CATEGORY ECOLOGICAL PERSPECTIVE MANAGEMENT PERSPECTIVE
    Natural N No or negligible modification of in-stream and riparian habitats and biota Relatively untouched by human hands. No discharge or impoundments
    Good
    G
    Biodiversity largely intact Some human-related disturbance but ecosystems essentially in good state
    Fair
    F
    A few sensitive species may be lost in parts and lower abundances of some populations may occur Zones of competing uses. Some natural systems may occur but development pressures are prominent in other parts
    Poor
    P
    Only more tolerant species remain; alien species have invaded the ecosystem; population dynamics have been disrupted (e.g. where biota can no longer breed); species present areoften diseased. Often characterised by high human densities or extensive resource exploitation. Management intervention is needed ti improve river health - e.g. to restore flow patterns, river habitats or water quality

    SOR REPORTING FORMAT

    The national SoE report for South Africa uses the Driving Force-Pressure-State-Impact-Response framework to explain what is causing environmental change, how good or bad the conditions are and what we can and are doing about it. Aligned with this framework, SoR reporting describes the present state and trends in river conditions, the driving forces and pressures on the rivers, and the policies and management actions in place to manage the rivers:

  • Present health - The present health is a measure of the ecological state of the river during the time of the survey. Due to the time and event integrating nature of the indices used, the present health is a reflection of the response of the river to all the natural as well as human induced disturbances that have taken place prior to the survey. The present health of the river is expressed as a River Health Category, which gives an idea of how much the river has changed from its natural state.

  • Pressures and driving forces - Pressures are those factors that have an impact on the health of the river, while driving forces refer to the human activities, which create these pressures. Knowing the pressures on a river provides insight into why the river is in its present health. Examples of pressures are poor water quality, sedimentation and reduced flows. Examples of associated driving forces are discharge of untreated effluent, bad land management and abstraction of water.

  • Desired health - Some change in ecosystems is unavoidable. However, a balance must be struck between human and economic uses of water and the need to maintain the biophysical systems that these uses depend on. The desired health of a river is an indication of what the ecological state of the river should be, based on ecological considerations and sustainability. For the purpose of this report, the desired health was determined by considering the ecological importance and sensitivity of the specific river ecosystems. Ecological importance refers to the diversity, rarity or uniqueness of the habitats and biota. Consequently, it reflects how important the protection of these ecological attributes is, from a local, national and even international perspective. Ecological sensitivity refers to the ability of a specific ecosystem to tolerate disturbances and to recover from certain impacts.

  • Management action - Once the present as well as the desired health of a river is known, the need and priorities for management intervention can be determined. Management action refers to what is being done, whether current actions are effective and what more should be done to improve river health. Management actions may include policies, national and local management strategies or specific initiatives regarding the management of aquatic ecosystems or natural resources in general.
  • subsistance fishing - Clayton Cook fruit sellers, May 2001 - Wilma Strydom a tea estate, May 2001 - Wilma Strydom

    OVERVIEW OF THE STUDY AREA

    TERRAIN

    The Groot Letaba, Politsi, Debengeni, Thabina and Letsitele rivers rise in the Northern Drakensberg Mountains between 1 100 and 1 800 m above mean sea level (amsl) and cascade down the steep slopes in a north easterly direction. The undulating plains of the lowveld catchment are drained by the Groot Letaba River and its major tributaries the Klein Letaba, the Middle Letaba, Nsami and Molototsi rivers. The Letaba River flows eastwards across the Kruger National Park (KNP), where it joins the Olifants River a short distance upstream of the Mozambique border.

    The Luvuvhu River and the Sterkstroom rise on the southern side of the Soutpansberg Mountains east of Louis Trichardt between 1 000 and 1 400m above mean sea level (amsl). Further eastwards, the Latonyanda, Dzindi, Mutshindudi and Mutale tributaries join the Luvuvhu, all originating from within the mountain ranges east of the Entabeni and Vondo forestry areas. The Luvuvhu River traverses the Kruger National Park and joins the Limpopo River at Crook?s Corner on the Mozambique border.

    CLIMATE

    The change in topography (altitude and relief) gives rise to varied climatic characteristics. The mountain zone has a rainfall of some 2 000mm/a and the dry lowveld in the KNP 400mm/a. More than 85% of the rain falls during the summer months. Evaporation increases gradually from 1 400mm/a in the west to 1 900mm/a in the east. About 60% of the evaporation occurs during the 6 months from October to March.

    Temperatures range from a high average of 21°C in the upper catchments, to a very high average of 25°C in the KNP. Frost rarely occurs.

    LAND USE

    NATURAL AREAS OF IMPORTANCE

    The upper Letaba Catchment contains numerous areas of importance. The Wolkberg Wilderness area is renowned as an important biodiversity ?hotspot?. Scenic waterfalls occur throughout the escarpment, with probably the most well known being the Debengeni Waterfall. The Modjadji Cycad Reserve holds unique populations of these prehistoric plants. In the lower catchment, numerous private nature reserves, the provincial Merensky Reserve and Letaba Ranch are found. The lowveld region has a number of important geothermal springs (the resort in the Hans Merensky Nature Reserve and Soutini Baleni on the banks of the Klein Letaba River). Indigenous forests in the upper Luvuvhu Catchment include Hanglip, Piesangkop, Entabeni and Thathe Vondo and Vhutanda sacred forests. The provincial Mphaphuli Cycad Reserve is located within a biodiversity hotspot near the confluence of the Luvuvhu and Mutshindudi rivers. Lake Fundudzi in the upper Mutale River is one of the very few natural inland lakes in South Africa. Scenic gorges occur in both the Mutale and Luvuvhu rivers. The Luvuvhu Gorge divides the Makuya Provincial Reserve from the Kruger National Park. The Pafuri floodplain has been proposed a wetland of international importance (Ramsar site).

    AGRICULTURE AND FORESTRY

    The upper catchments of both the Drakensberg and Soutpansberg mountains are dominated by forestry plantations (pines, eucalyptus and alien mahoganies). The foothill zones of both mountain ranges contain tea estates. The Tzaneen and Letsitele regions of the Letaba Catchment support citrus, mangos, and bananas. The Klein Letaba, Molototsi and Nsami River catchments are dominated by rural populations with cattle, goats and subsistence farming.

    The Levubu agricultural area in the Luvuvhu Catchment, produces citrus, mangos, bananas and macadamias, while further downstream in the Luvuvhu Catchment, the Mutshindudi and the Mutale River catchments are dominated by rural community gardens, cattle and goats.

    POPULATION

    The most common languages in the study area are Tshivenda, Xitsonga and Afrikaans. A significant portion of the study area falls within the KNP and thus has a very low population. Fewer visitors frequent the northern section of the park compared to the southern regions.

    Less than 5% of the population of more than 1 130 000 inhabitants in the Letaba Catchment have fully reticulated water supply systems. The remainder of the population obtain water from street pipes, boreholes, hand pumps, streams and springs. Tzaneen, Giyani and Letsitele are the larger formal towns in the Letaba Catchment.

    The majority of the 770 000 people in the Luvuvhu Catchment live in rural villages. The villages are heavily concentrated along the river systems. The town of Thohoyandou, with its surrounding villages, is the area of greatest human concentration in the Luvuvhu Catchment.

    ECONOMIC PROFILE

    The economy of the study area is based on forestry, tea, subtropical fruits, summer crops, vegetables and livestock farming. The GGP of the Groot Letaba River catchment was about R491 million in 1994. Subsistence farming plays a major role in the economies of both catchments. Ecotourism is regarded as a core industry of the Northern Province and the study area.

    A coal mine exists in the Luvuvhu Catchment, while gold mines occur along the Klein Letaba River. Numerous mining developments are under consideration in the Tzaneen area, but are subject to the availability of water.

    A large number of people in the study area are unemployed. Only 10% of the people with jobs are employed in the Letaba and Luvuvhu catchments. Many are migrant workers, travelling to Johannesburg for work. The provincial government is the largest employer in the region.

    DEVELOPMENT PRIORITIES

    Demands for water in the Letaba catchment already exceed the available water resources. A new dam in the Letaba River at the confluence with the Nwanedzi River has been evaluated, together with a possible development option in the Letsitele River. The economic viability of both options is still under review. Improved operating techniques appear to offer a more favourable option compared to the construction of new impoundments at this time.

    The Luvuvhu Government Bulk Water Supply Scheme is due to be operational in 2002. The scheme comprises of the new Nandoni Dam and associated Xikundu Weir. The scheme will interlink with water supplies from both the Albasini Dam and Vondo Dam.

    Land-use development is likely to occur mainly in the western and central third zones of the Letaba and Luvuvhu catchments and is likely to be limited to the agricultural and residential sectors. Some industrial/commercial developments may stem from primary development. Development in the semi-arid and more remote parts of the catchment is likely to be limited. Further forestry development in the mountainous region of the catchment is limited.

    ECOREGION CHARACTERISTICS

    1. Limpopo Plain

    ECOREGION 1.01 ECOREGION 1.02

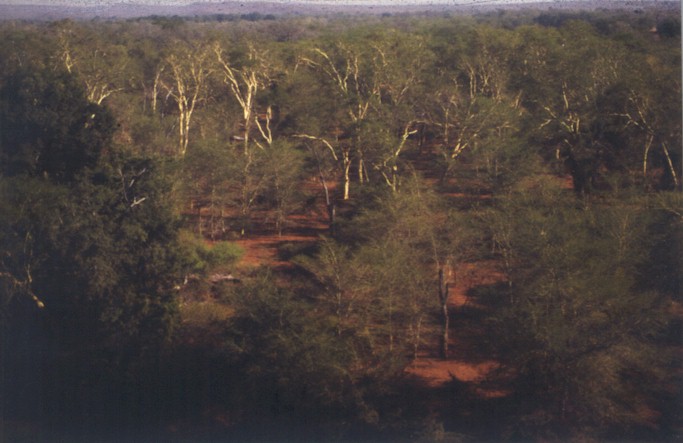
    Landscape: Undulating landscape, plains and lowlands with low to moderate relief
    Vegetation: Mopane Bushveld
    Altitude: 200 to 475m
    Annual rainfall: 200 to above 525mm
    Temperature:1.5 to 42.5?C (mean annual 23?C)
    Soils: Alluvial soils, sands and gravel
    Geology: Sandstone, shale, grit, conglomerate, quartzite and basalt.

    Landscape: plains and lowlands with low to moderate relief
    Vegetation: Soutpansberg Arid Mountain Bushveld
    Altitude: 225 to 650m
    Annual rainfall: 225 to 500mm
    Temperature: 3 to 44?C (mean annual 22?C)
    Soils: Acidic sandy, loamy to gravely
    Geology: Sandstone, quartzite and shale
    2. Central Highlands
    ECOREGION 2.01 ECOREGION 2.15

    Landscape: Undulating landscape, hills and low mountains with moderate relief
    Vegetation: Sour Lowveld Bushveld, Soutpansberg Arid Mountain Bushveld and patches of Afromontane Forest
    Altitude: 325 to 1 550m
    Annual rainfall: 300 to 2 025mm
    Temperature: 2 to 44?C (mean annual 20?C)
    Soils:Sandy to sandy loam soils in the uplands to clayey soils in the bottomlands
    Geology: Granite and gneisses (sandstone, quartzite and shale)

    Landscape: Mountains with high to moderate relief
    Vegetation: Northeastern Mountain Grassland and Afromontane Forest.
    Altitude: 825 to 2 100m
    Annual rainfall: 475 to 2 000mm
    Temperature: -8 to 39?C (mean annual 16?C)
    Soils: Mostly shallow lithosols
    Geology: Granite, quartzite, mudstone, sandstone and shale
    4. Great Escarpment Mountains
    ECOREGION 4.03

    Landscape: Mountains with high relief
    Vegetation: Northeastern Mountain Grassland and patches of Afromontane Forest
    Altitude: 625 to 1900m
    Annual rainfall: 600 to 1 325mm
    Temperature: -8 to 39?C (mean annual 18?C)
    Soils: Shallow lithosols
    Geology: Variety of rock types
    5. Lowveld
    ECOREGION 5.01 ECOREGION 5.02

    Landscape: Plains and open hills with low to moderate relief
    Vegetation: Mopane Shrubveld
    Altitude: 200 to 475m
    Annual rainfall: 325 to 975mm
    Temperature:-1 to 46?C (mean annual 22?C)
    Soils: Clayey
    Geology: Basalt

    Landscape: Undulating landscape, plains and open hills with low to moderate relief
    Vegetation: Mopane Bushveld
    Altitude: 200 to 800m
    Annual rainfall: 250 to 725mm
    Temperature: 1.5 to 42.5?C (mean annual 22?C)
    Soils: Loamy sands and clayey soils
    Geology: Granite
    ECOREGION 5.03 ECOREGION 5.04

    Landscape: flat to undulating landscape - plains with low to moderate relief, hills with high relief
    Vegetation: Mixed Lowveld Bushveld
    Altitude: 450 to 1 300m
    Annual rainfall: 350 to 1 050mm
    Temperature: -4 to 45?C (mean annual 21?C)
    Soils: A range of sandy to clayey soils
    Geology: Granite and gneiss with dolomite intrusions

    Landscape: Undulating landscape - hills and low mountains with moderate relief
    Vegetation: Sour Lowveld Bushveld and patches of Afromontane Forest
    Altitude: 450 to 1 425m
    Annual rainfall: 425 to 1 875mm
    Temperature: 2 to 34?C (mean annual 20?C)
    Soils: From sandy loam in the uplands to clayey in the bottomlands
    Geology: Granite and gneiss
    ECOREGION 5.05 ECOREGION 5.07

    Landscape: Hills and low mountains with high relief - the lower eastern slopes and foothills of the Drakensberg and Soutpansberg
    Vegetation: Sour Lowveld Bushveld, Mixed Bushveld and patches of Afromontane Forest
    Altitude: 475 to 1 825m
    Annual rainfall: 425 to 1 725mm
    Temperature: 2 to 43? (mean annual 19?C)
    Soils: Deep sandy to sandy loam soils in the uplands to clayey or shallow coarse sandy soils in bottomlands
    Geology: Quartzite, sandstone, shale, granite and gneiss

    Landscape: Plains with low relief
    Vegetation: Sweet Lowveld Bushveld
    Altitude: 175 to 425m
    Annual rainfall: 375 to 775mm
    Temperature: -2 to 43?C (mean annual 22?C)
    Soils: Relatively shallow black, brown or red clayey soil
    Geology: Basalt
    6. Lebombo Uplands
    ECOREGION 6.01

    Landscape: Hills with moderate relief, undulating rocky terrain
    Vegetation: Lebombo Arid Mountain Bushveld
    Altitude: 150 to 500m
    Annual rainfall: 400 to 950mm
    Temperature: -1 to 46?C (mean annual 22?C)
    Soils: Shallow, acidic, sandy soils - can be classified as lithosols
    Geology: Rhyolite and granophyres