In developing the ecosystem response index the experts said the following features should be present in the final index...
To verify that the response index does have the above characteristics, the ecosystem response model and the index were run on artificial input sequences. The artificial sequences were not designed to emulate natural sequences, but rather to allow one to see the effect of specific characteristics on the ecosystem response index.
Figure 22 shows an example artificial sequence with
an amplitude of ![]() , a period of 10 years and a maximum salinity gradient (100%)
across the lake.
, a period of 10 years and a maximum salinity gradient (100%)
across the lake.
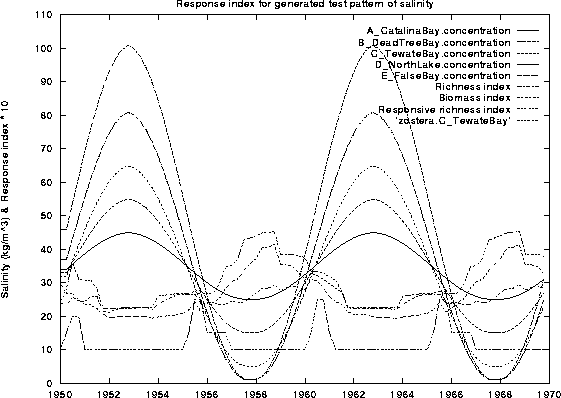
Figure 22: The artificial salinity sequence overlaid with response
indices for 1) Single species, 2) Specie richness, 3) Biomass, 4) Specie richness version
2
Figure 23 graphs the ecosystem index response to changes in amplitude and period.

Figure 23: Response of the ecosystem species richness index to changes in
period and amplitude of salinity fluctuation.
In this graph an artificial sinusoidal salinity time series is fed into the ecosystem response model. The salinity is kept the same in each lake cell. Note...
The same graphs for the responsive richness index and the biomass index do not show anything qualitatively different.
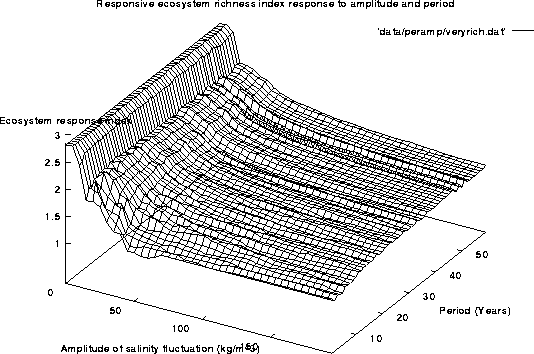
Figure 24: Response of the more responsive ecosystem species richness
index to changes in period and amplitude of salinity fluctuation.
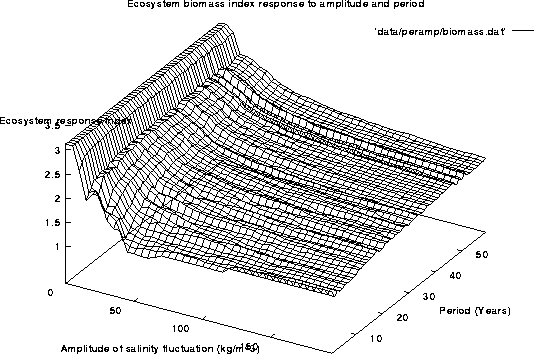
Figure 25: Response of the ecosystem biomass index to changes in period
and amplitude of salinity fluctuation.
The biologists believe that shutting the mouth could result in a loss of the salinity gradients within the lake and a subsequent loss to the ecosystem diversity. Figure 26 shows the effect of salinity gradient and period on the ecosystem index. The gradient varies from 0% in which all cells have the same salinity, and 100% in which the amplitude varies evenly from a maximum in False bay to a minimum in Catalina bay.
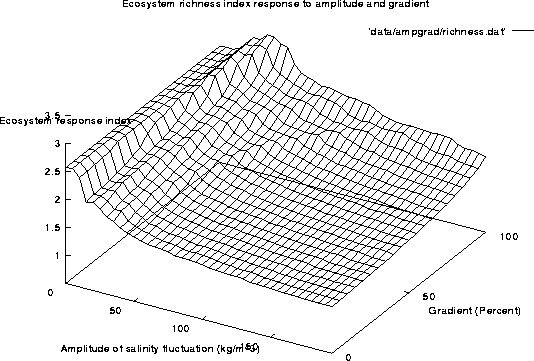
Figure 26: Response of the ecosystem species richness index to changes in
salinity gradient and amplitude of salinity fluctuation.
As can be seen from figure 26, the higher the salinity gradient the better the ecosystem response index. In fact, now the best response no longer occurs at 0 amplitude, but at a slightly higher amplitude and maximum salinity gradient.
The responsive ecosystem index, see figure 27 does not show any behaviour that is qualitatively different from the ordinary index.
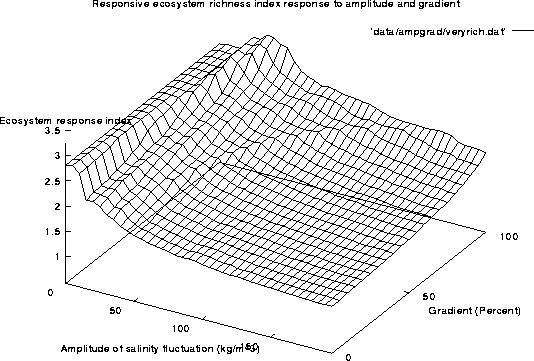
Figure 27: Response of the more responsive ecosystem species richness
index to changes in salinity gradient and amplitude of salinity fluctuation.
The biomass index, see figure 28 also increases with increasing salinity gradient, but is at a maximum at 0 amplitude.
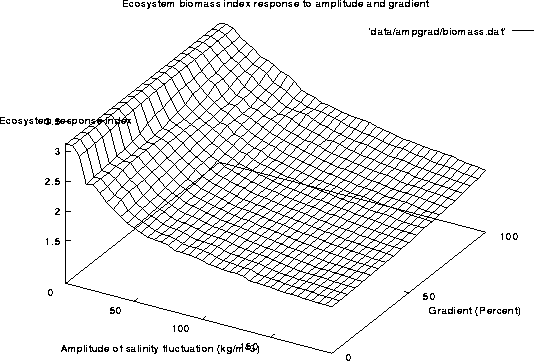
Figure 28: Response of the ecosystem biomass index to changes in salinity
gradient and amplitude of salinity fluctuation.
As figure 29 shows, the ecosystem response index does not exactly duplicate the Remane curve. This is because the index is closely tied to the eight indicator species selected whereas the Remane curve reflects the many thousands of estuarine species.
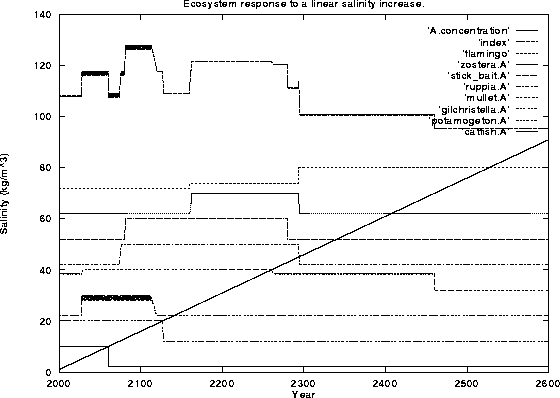
Figure 29: Ecosystem response to a linear increase in salinity. The
y-axis shows salinity in ![]() and the x-axis time in years. The slowly
increasing straight line is the salinity. All other traces are ecosystem response indices
arbitrarily scaled and shifted from the original 1 to 5 range to overlay on the same graph
as the salinity.
and the x-axis time in years. The slowly
increasing straight line is the salinity. All other traces are ecosystem response indices
arbitrarily scaled and shifted from the original 1 to 5 range to overlay on the same graph
as the salinity.