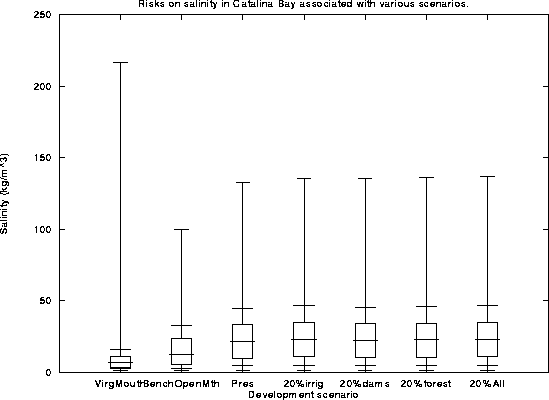
Figure 36: The risks on salinity in Catalina associated with various scenarios for development.
The following scenarios were evaluated...
Input data sequences for the various scenarios were estimated using the Pitman model. To evaluate the risks associated with these scenarios, the input sequences where bootstrapped to 4000 years and the models run.
Figure's 36, 37, 38, 39 and 40 display the results.

Figure 36: The risks on salinity in Catalina associated with various
scenarios for development.
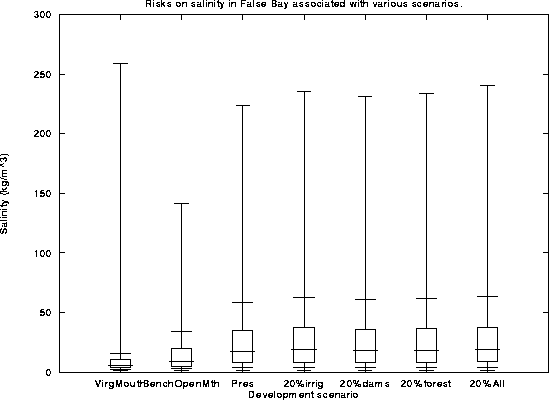
Figure 37: The risks on salinity in False Bay associated with various
scenarios for development.
Notes on the salinity boxplots....
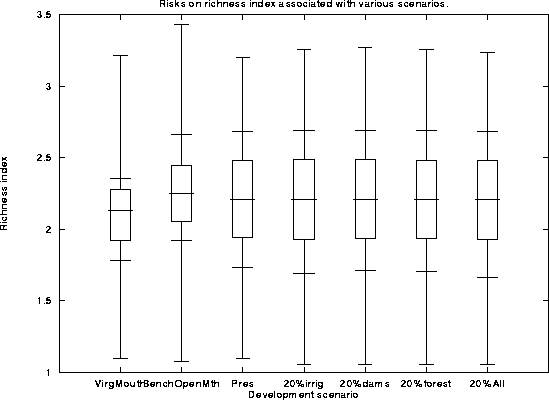
Figure 38: The risks on the richness index associated with various
scenarios for development.
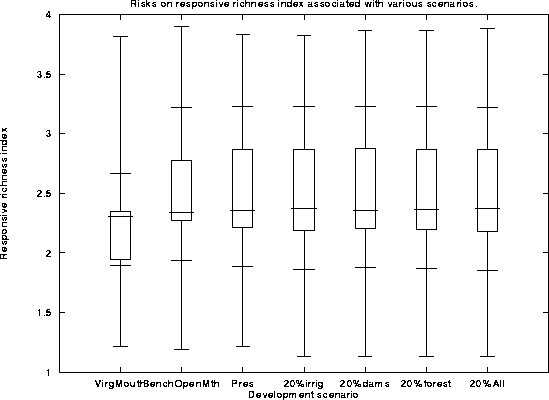
Figure 39: The risks on the responsive richness index associated with
various scenarios for development.
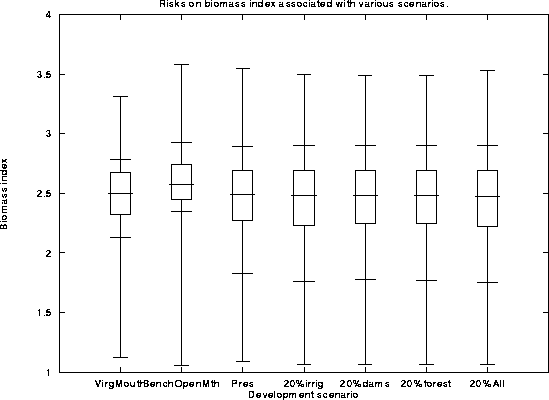
Figure 40: The risks on the biomass index associated with various
scenarios for development.
One curiosity is that the ecosystem indices are better under present day conditions than under benchmark flow with virgin mouth operation. This is because the present day system is far more marine in nature, and the indices are heavily weighted towards species richness and biomass. Thus the lake is now more suitable for the many marine species.