where w = X/100.0,
If one takes the benchmark scenario as 0% of current development, and the % present day measured values as 100% current development, one can interpolate and extrapolate to see what the effect would be of increasing or decreasing man's impacts on the catchment.
This is done by the very simple equation, at each time step, let the X% value be...
![]()
where w = X/100.0, ![]() if the present day value,
if the present day value, ![]() is the benchmark
naturalized value. Note if X = 0,
is the benchmark
naturalized value. Note if X = 0, ![]() and if X = 100%, then
and if X = 100%, then ![]() .
.
The input data can be interpolated and extrapolated in this fashion for several values of X. Figures 41 and 42 show the effect different values of X on the salinity time series.
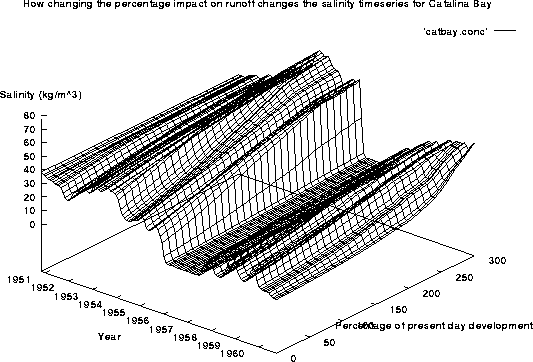
Figure 41: The effect of changing man's impact on catchment runoff has on
the salinity time series for Catalina Bay.
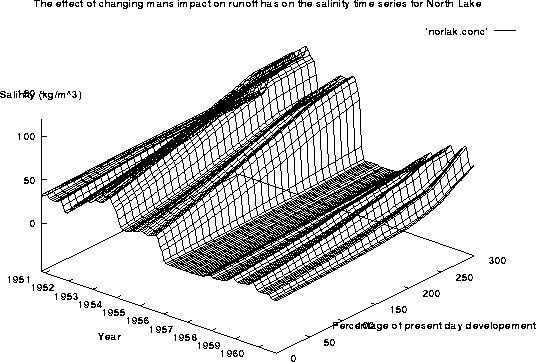
Figure 42: The effect of changing man's impact on catchment runoff has on
the salinity time series for North Lake.
An unfortunate side effect of extrapolating into the future, is that sometimes the rivers flow backwards. What is happening here is that the projected demand exceeds the available supply. A more realistic approach is to assume that if such a scenario is likely, the department will build more dams. The overdemand will be met by storing excess flood waters in dams and releasing it as required. I emulated this by reversing the time sequence, and calculating the anticipated demand and subtracted it from earlier flows.
Note that hypersaline events form a ``plateau'' at high values of X as the rivers are dry and all minor flow peaks have been scavenged. Further development results only in decreasing major flood peaks which are, in any case, more than sufficient to reset the lake to fresh.
To remove the effects of a relatively short period of stream record, one can boot strap the data over 500 years. The figures 43 and 44 show the long term ranges of salinity associated with various levels of development.
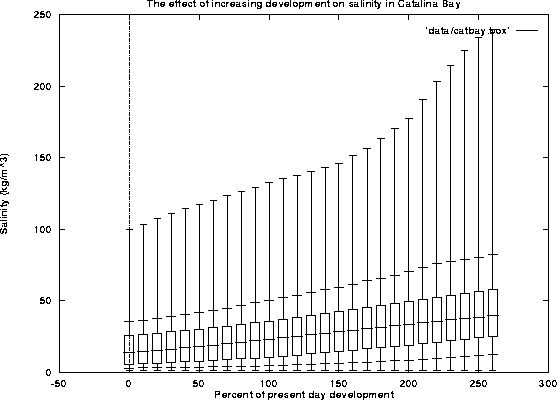
Figure 43: Boxplots of the salinity in Catalina Bay vs percentage of
present day development
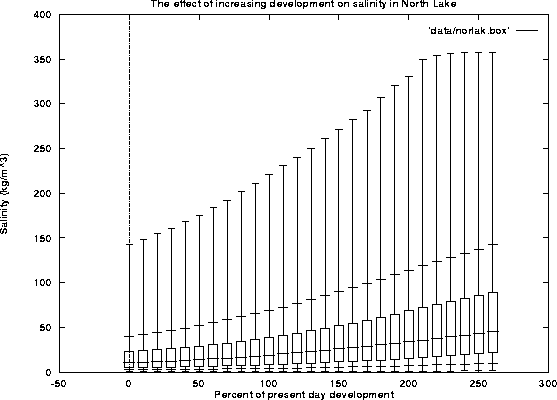
Figure 44: Boxplots of the salinity in North Lake vs percentage of
present day development
The results of the salinity model can be fed through the ecosystem response model, and an ecosystem response index can be calculated. Figure 45 shows the long term ranges of ecosystem response index associated with various levels of development.
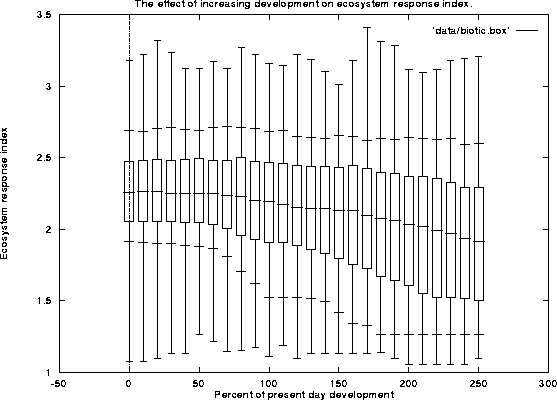
Figure 45: Boxplots of the ecosystem response index vs percentage of
present day development