


Eutrophication Hot Spots
-
What does this dashboard relate to :
This dashboard shows water bodies with high levels of nutrients. The dashboard presents the information in the form of hot-spots with high trophic potential. Eutrophication, the enrichment of lakes and reservoirs with plant nutrients such as nitrogen and phosphorus, “is an ongoing concern facing human societies around the world. Once thought to have been resolved using engineering approaches such as municipal wastewater treatment and storm water management, the problem of nutrient enrichment not only persists, but even continues to increase, being manifested in harmful algal blooms, limitations on access to safe drinking water supplies, and related concerns associated with fresh water in lakes and reservoirs. The continuing concern surrounding eutrophication fulfils the many attributes of a ‘wicked’ or complex problem facing society.” [Thornton, J. A., Harding, W. R., Dent, M., Hart, R. C., Lin, H., Rast, C. L., Rast, W., Ryding, S.-O., Slawski, T. M., Dec. 2013. Eutrophication as a 'wicked' problem. Lakes & Reservoirs: Research & Management 18 (4), 298-316. URL http://dx.doi.org/10.1111/lre.12044 ]
-
What is the main purpose of the dashboard?
The main purpose of the dashboard is to convey where the Eutrophication (nutrient enrichment) hot-spots exist in South Africa or for a selected WMA. The dashboard is designed to answer the following questions:
- Where are the Eutrophication hot-spots (at National or WMA scale),
- What do the trends look like at these hot-spot sites,
-
Does eutrophication pose a health risk to society?
High nutrient levels in water bodies support the growth of various floating plants, algae and cyanobacterial species. Some cyanobacterial species can pose risks to the health of humans and animals. The implication is that water bodies with high nutrient levels need to be monitored closely to ensure that we know when hazardous cyanobacterial species bloom. Apart from posing a risk to societal health, there are other detrimental effects associated with cyanobacterial and algal blooms, which include a reduction in the ability to use the water bodies for recreational purposes, and the emission of foul smelling odours which can be problematic to people who live near the water bodies.
-
Is the eutrophication dashboard for operational or for planning purposes?
Observed water quality readings can take weeks to months to be verified and uploaded into the water management system (WMS) used to store this information. The information here is therefore not real-time or even near-real time in nature, and is thus more suited for planning. If verified water quality readings become available more quickly, for example from satellite observations, the dashboard could be used to help guide operational water management decisions.
-
Why is eutrophication monitored?
Water related policy in South Africa is based on a number of guiding principles. One of the environmental principles is that environmental change should be monitored so that improvements can be encouraged and detrimental impacts minimised. The monitoring of eutrophication trends is part of this process. Some South African impoundments are ranked amongst the most eutrophic in the world, and many South African impoundments exhibit high nutrient enrichment with consequent eutrophication-related problems.
-
-
Person(s) who championed the dashboard:
-
Elijah Mogakabe
Resource Quality Information Services (RQIS)
-
Elijah Mogakabe
-
Enquiries:
- For all dashboard enquiries click HERE to go to the Contact Us page.
-
What type/s of questions does the information product aim to answer:
The primary questions this dashboard aims to answer include:- Where are the most 10 problematic hot-spots with the highest risk of eutrophication,
- What are the trends at these hot-spot sites? The user can select one of three time period options, i.e. prior 3 months, prior year, full record available.
-
Data / Information discussion:
-
What data is used?
There are two main types of data that indicate trophic status, namely chlorophyll a and total phosphorus. Initially this dashboard will focus on:
- Trophic status as represented by chlorophyll a measurements, mainly in dams.
Provision will be made in the WMS data extraction process for later inclusion of phosphorus measurements.
-
How is data extracted and from where?
Water quality samples are taken by RQIS and regional staff, at prescribed intervals, and analysed at the RQIS laboratories. Separate samples are required for chlorophyll and for water chemistry. The water quality parameter results are validated, and then captured in the WMS database. The validation and upload into WMS can take several months. A stored procedure, which is a script in the WMS database, compares the values of the observed verified water quality readings against the classification values. Five classes are discerned; Oligotrophic, Mesotrophic, Eutrophic and Hypertrophic (see the table below). NIWIS initiates the stored procedure every Sunday evening.
-
Calculations done in NIWIS
From the activation of the stored procedure in the WMS database, NIWIS captures the eutrophication status classes and reclassifies them into 3 classes, which represent:
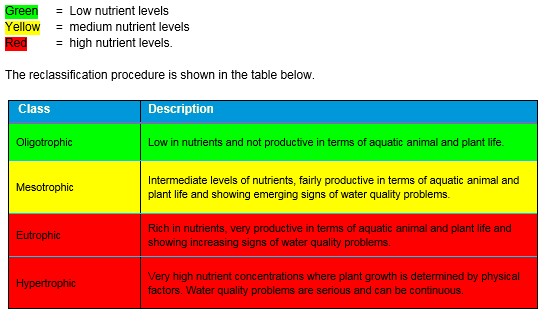
-
What data is used?
-
Links to other sources of related information
- http://www.dwa.gov.za/iwqs/eutrophication/NEMP/default.aspx
- A link to information related to the South African water quality guidelines, 1996 can be found at:South African water quality guidelines, 1996
- A link to Reserve Determination Measures (RDM) can be found at:Reserve Determination Measures
- For more information about the classification method, clickhere
- For more detailed monitoring results from the eutrophication programme, clickhere
-
Are there any limitations / cautions related to using this information?
Yes, please refer to the below:
Copyright: The copyright of the data/information remains with the Department of Water and Sanitation. This approval to use the data/information cannot be construed as a transfer of copyright.
Usage: All data is supplied free of charge and may not be sold to third parties. The use of information data is restricted to use for academic, research or personal purposes.
Quality: All data is supplied with no expressed or implied warranty as to its suitability for purpose, accuracy or completeness.
Status: Meanwhile data is continuously updated; the data set(s) supplied are already historical on the day of supply.
Acknowledgement: Whenever used in publications or the electronic media, the Department Water and Sanitation is to be mentioned as the proprietor of the relevant copyright.