| RHP |
South African
River Health Programme |
State of the Rivers Report
Crocodile, Sabie-Sand & Olifants River Systems |


|
|
The Crocodile River System |
|
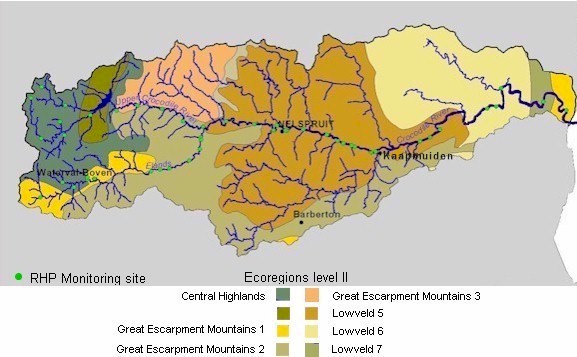
Catchment overview
The Crocodile Catchment covers about 10 450 km2. The naturalised mean annual runoff is
The estimated water use in 1997 was 580 million cubic metres per year, of which irrigation accounted for 49%, forestry 43% and industry, commerce and mining the remaining 8%. An assessment for the determination of the Reserve for the Crocodile River has not yet been completed. DWAF is in the process of making provision for supplying all residents of the catchment with a minimum of 25 litres per person per day. The environmental water requirements, domestic water supply objectives, and international obligations (water supply to Mozambique), are priorities for water allocation from present and future dams. Future irrigation and water intensive industries are likely to either be constrained or forced to utilise more resource-conservative methods. |
|
Summary of findings
Move cursor over map and select specific area to view detailed map and Present Ecological State (PES) findings.
|


|