
This browser tool provides access to
the Water and Sanitation water quality
sites, some monitored as early as the
1950s. Many are groundwater sites with
only one record, others are river sites
with thousands of samples. Links are
available to static PNG graphs
and data files listing the more common
water quality constituents. Files for
displaying data in Google
Earth help you to see sites in
relation to one another and to assess
the strengths and weaknesses of the
sampling network.
Follow a Sites
link at the left to make a selection.
The table links provide the widest choice, while the map links
are useful if you are unfamiliar with the drainage regions and management areas.
Top 333 shows the monitoring sites that form the core of the
National Chemical Monitoring Programme.
To view only the hydrological stations labelled with
"station catalogue" codes, choose a rivers, dams or estuaries link.
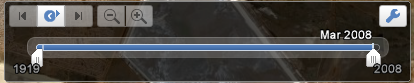
Time slider
These Google Earth KMZ
files are time-enabled: if a site is
not visible, it may have starting and
ending dates outside the date range
set in the time slider at the top
of the Google Earth display
(Google Earth version 4 and later).
Double-click on the menu item to show
all available dates or move
the slider and its limit bars to
show sites that were active within a time
window. Click on the small clock face
(GE 4) or spanner (GE 5, 6) for
other options. Note that selecting and unselecting check boxes
in the GE table of contents sometimes resets the time range.
Definitive data source
These web pages provide a snapshot
of the WMS database and may lag
behind the live database by several months.
The zipped comma-delimited files provided
for use in spreadsheets are
not live data, nor do they show where results
are below the detection limit for a particular method:
the WMS
database is the definitive data
source.
Please address any
surface water quality data
requests to Marica Erasmus at Resource Quality Information Services
and
groundwater data queries to Georequests under Hydrological Services.
pH
Treat pH data for the years 1978-1989 with caution, especially where the alkalinity is low.
The dataset has a systematic downward bias during this period.
Browser problems
(April 2014) Google Earth applications run on
devices operating under iOS and Android.
However, mobile versions of Google Earth may limit
the number of monitoring sites displayed.
Some versions do not display any sites at all.
(May 2012) Some versions of Google Earth,
from version 5.2 onwards, had a bug in
the links within popup balloons.
Google located the source of the problem
and versions from 6.2.1 work correctly.
Please report problems with
these pages, or make suggestions for
improvements, to the WMS team.
Last update of this page
2016-04-08 08:21
|