|
In order to use the Google Earth interface,
you will first need to download and install
Google
Earth. You can, however, access the
tabular data without Google Earth. Some sites
are available in Google Maps format.
On the main water resource explorer page,
choose whether you wish to browse by
primary drainage region, water
management area, hydrological sites on
rivers or hydrological sites on
dams. Primary drainage regions are
the broad hydrological catchment areas in
South Africa, while water management
areas are the water administrative
regions. The hydrological sites are
the approximately 3000 gauging stations on
rivers and dams (lakes): these
are the links of interest to hydrologists.
Clicking on the primary drainage
region link takes you to a table of
drainage regions. If you are unfamiliar with
this classification system, choose Select
sites from map. Otherwise, choose your
drainage region of interest from one of the
columns. The first column is for opening the sites in Google Maps,
while the next four columns assume that
you have Google Earth installed. The
last two columns take you to simple (but rather long)
tables of sites.
The data set includes thousands of boreholes
(wells) with only one or two results each,
hence the grouping of sites into no
boreholes and with boreholes.
Within a group, choose to show either simple
icons at each site, or the more complex
Maucha diagrams (useful if you are interested
in the ionic composition of the water).
If you are just trying out the system, choose
Google Earth, no boreholes -
Icon markers -- K: Kromme et
al.
Depending on your browser configuration,
Google Earth may open the file automatically,
but sometimes you need to save the
K_reg_WMS_nobor.kmz file and open it
manually. You can look for possibe solutions
to problems of this kind at
Google Earth Hacks Forums.
When all the above steps have worked
correctly, you will see a piece of the South
African coastline (the Garden Route).
The Places panel on the left will
contain a new hierarchy labelled K
surface with icons labelled Canal,
Rivers, etc.
|
|
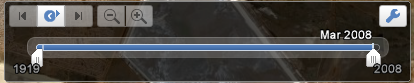
If no monitoring sites are visible on
the 3D-viewer, you need to expand the
time slider at the top right of
the viewer: select the right-hand edge
of the sliding cursor with your mouse
and drag it all the way across to the
right. All the monitoring sites should
now be visible (incidentally, the
slider is very useful for selecting
only sites active between certain
dates).
Now double-click on the Rivers
site labelled K7H1 ![[blue square marker with a black dot]](http://maps.google.com/mapfiles/kml/paddle/blu-circle-lv.png) . Google Earth zooms into the site
and you can use the controls as
described in the Google
Earth User Guide to zoom in and
out and pan and tilt the view.
. Google Earth zooms into the site
and you can use the controls as
described in the Google
Earth User Guide to zoom in and
out and pan and tilt the view.
Check in Google Earth under
Tools-> Options->
                            General
that Show results
in external browser is ticked,
otherwise the next step produces a
rather cluttered map.
Single-click on the K7H1 icon and a
balloon pops up explaining, sightly
cryptically, that this is
K7H001Q01 Bloukrans River At
Lottering Forest Res/Blaauw Kr.
Click on the graph link in the
balloon: after a short wait,
depending on the server and network
speeds, a browser window will open
with a PDF graph.
The graph is
a standard pre-generated time-series
of up to 17 water quality indicators,
plus flow if available. On the
right-hand side axis are statistical
summaries of the data.
|
|
If you would prefer to draw your own
graph, return to the balloon and click
on the data link. This will
download k70_102312.zip, which contains
the data used to draw the graph, a description of the data and a suggested citation.
|
If you have downloaded the water
quality data, you will have noticed
that the flow is missing. To get flow
data, click on flow in the
balloon. This opens the on-line
hydrological database for K7H001
Bloukrans River @ Lotterings For. Res.
Note the different codes used for the
same site: the water quality database
code is 102312, the full water quality
code is K7H001Q01 and the hydrological
code is K7H001. K70_102312 and K7H1 are
other variants used in this browser
system.
The key link in the balloon
takes you to
the page that explains the Maucha
salinity symbol that appears in many
pop-up balloons.
If you still have problems
accessing the system, please contact:
Michael Silberbauer (+27 12 808
9605).
Last updated
2016-05-12 14:01
|
|