|
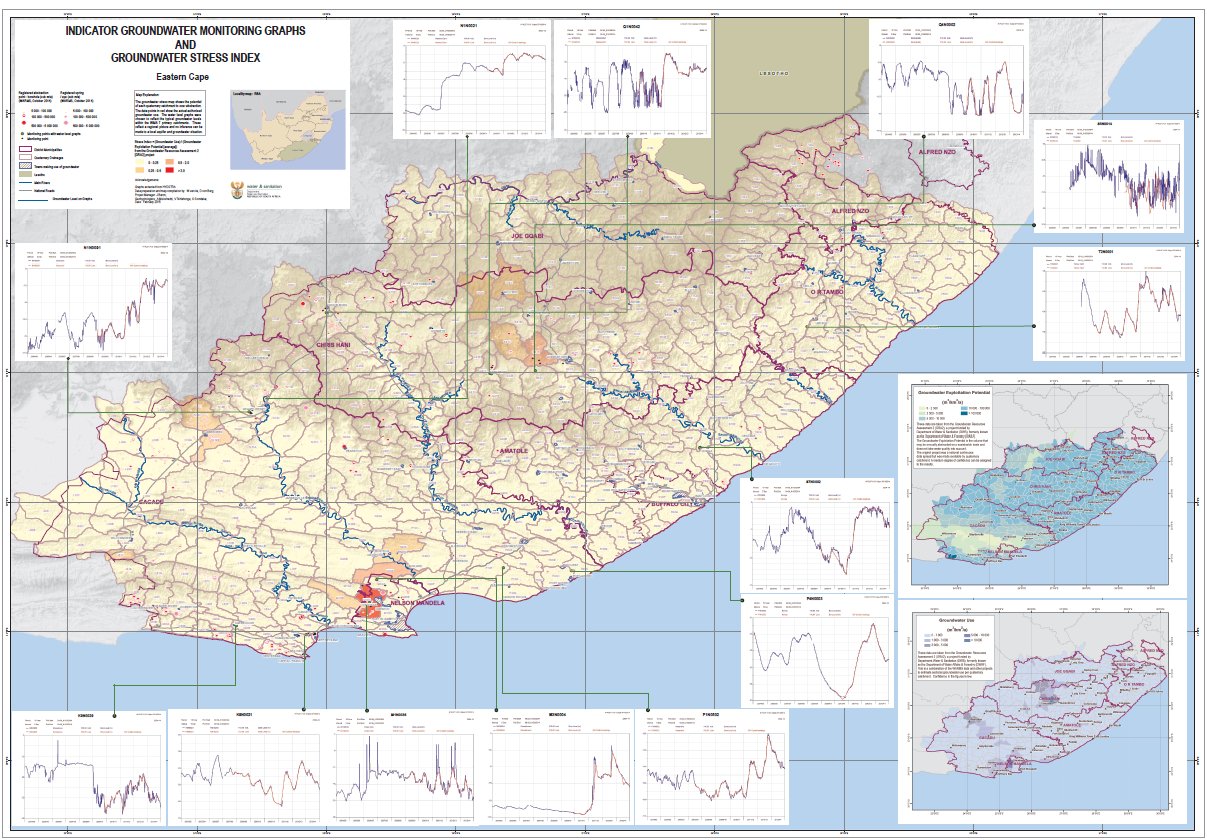
A recurring issue in groundwater resource management is how to present a
synoptic overview of the changing status of groundwater resources in a way that
is useful to senior managers and other decision managers. At small scales, and
with an abundance of data, contour maps of changes in water levels might be the
most appropriate tool. However at the regional scale that the workers were asked
to deliver a product there is simply too much heterogeneity in aquifer
characteristics, and too little data, for water level contours to indicate
useful information. The data can be presented in long reports with many graphs,
but this does not give a synoptic geographic overview. A compromise approach was
therefore selected of using water levels from indicator boreholes, depicted
geographically on a map, using "groundwater stress" as a backdrop. (Groundwater
stress is defined here as groundwater use divided by groundwater exploitation
potential).
|