|
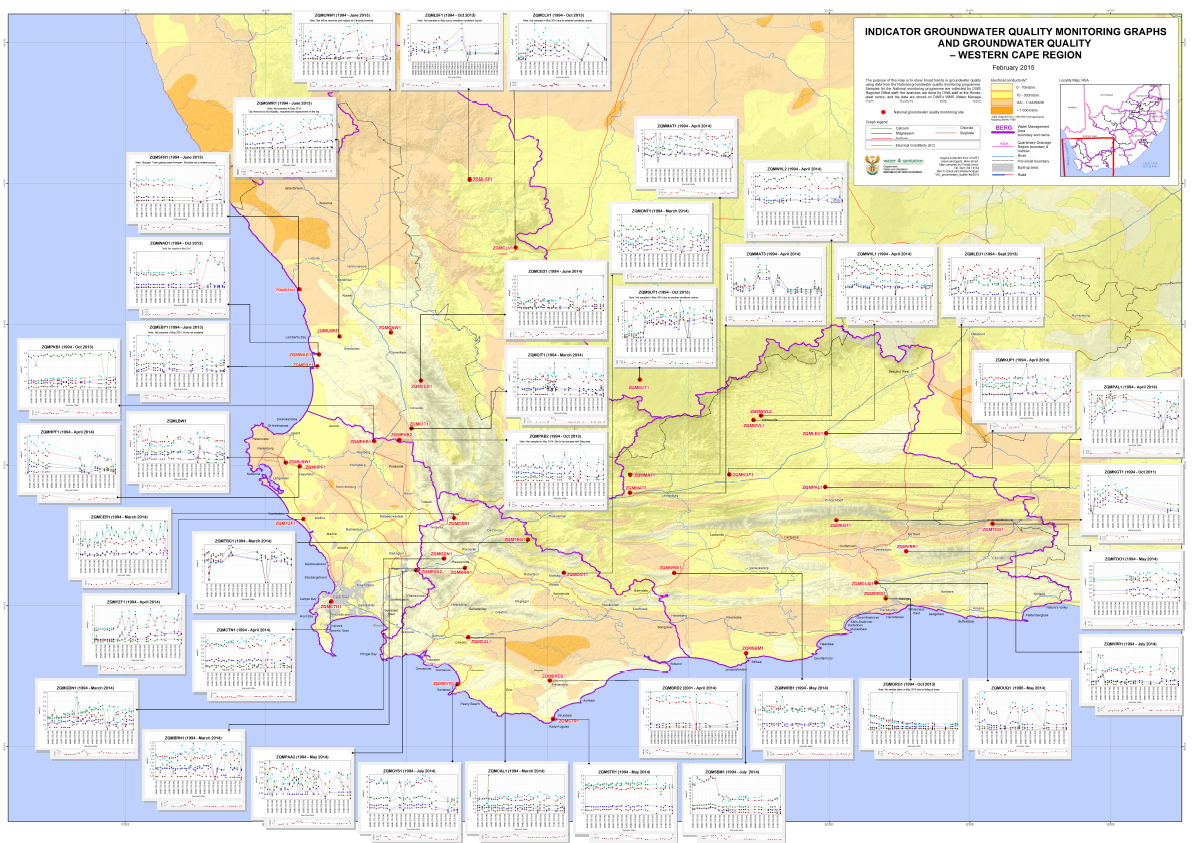
The purpose of this map is to give an overview of groundwater quality changes in
the Western Cape Region. The approach used was to select monitoring points and
use these as indicators for groundwater quality changes, rather than try to
generalize changes using - for example - contouring. The monitoring points
selected were those from the national groundwater quality monitoring (ZQM)
programme. The backdrop shows the regional variations in groundwater quality,
based on the 1:500 000 Hydrogeological Map series. One interesting trend that
can be seen on this map is that a large number of hot springs have shown
increasing chloride values for the last decade or so. The reason for this trend
is not known.
|