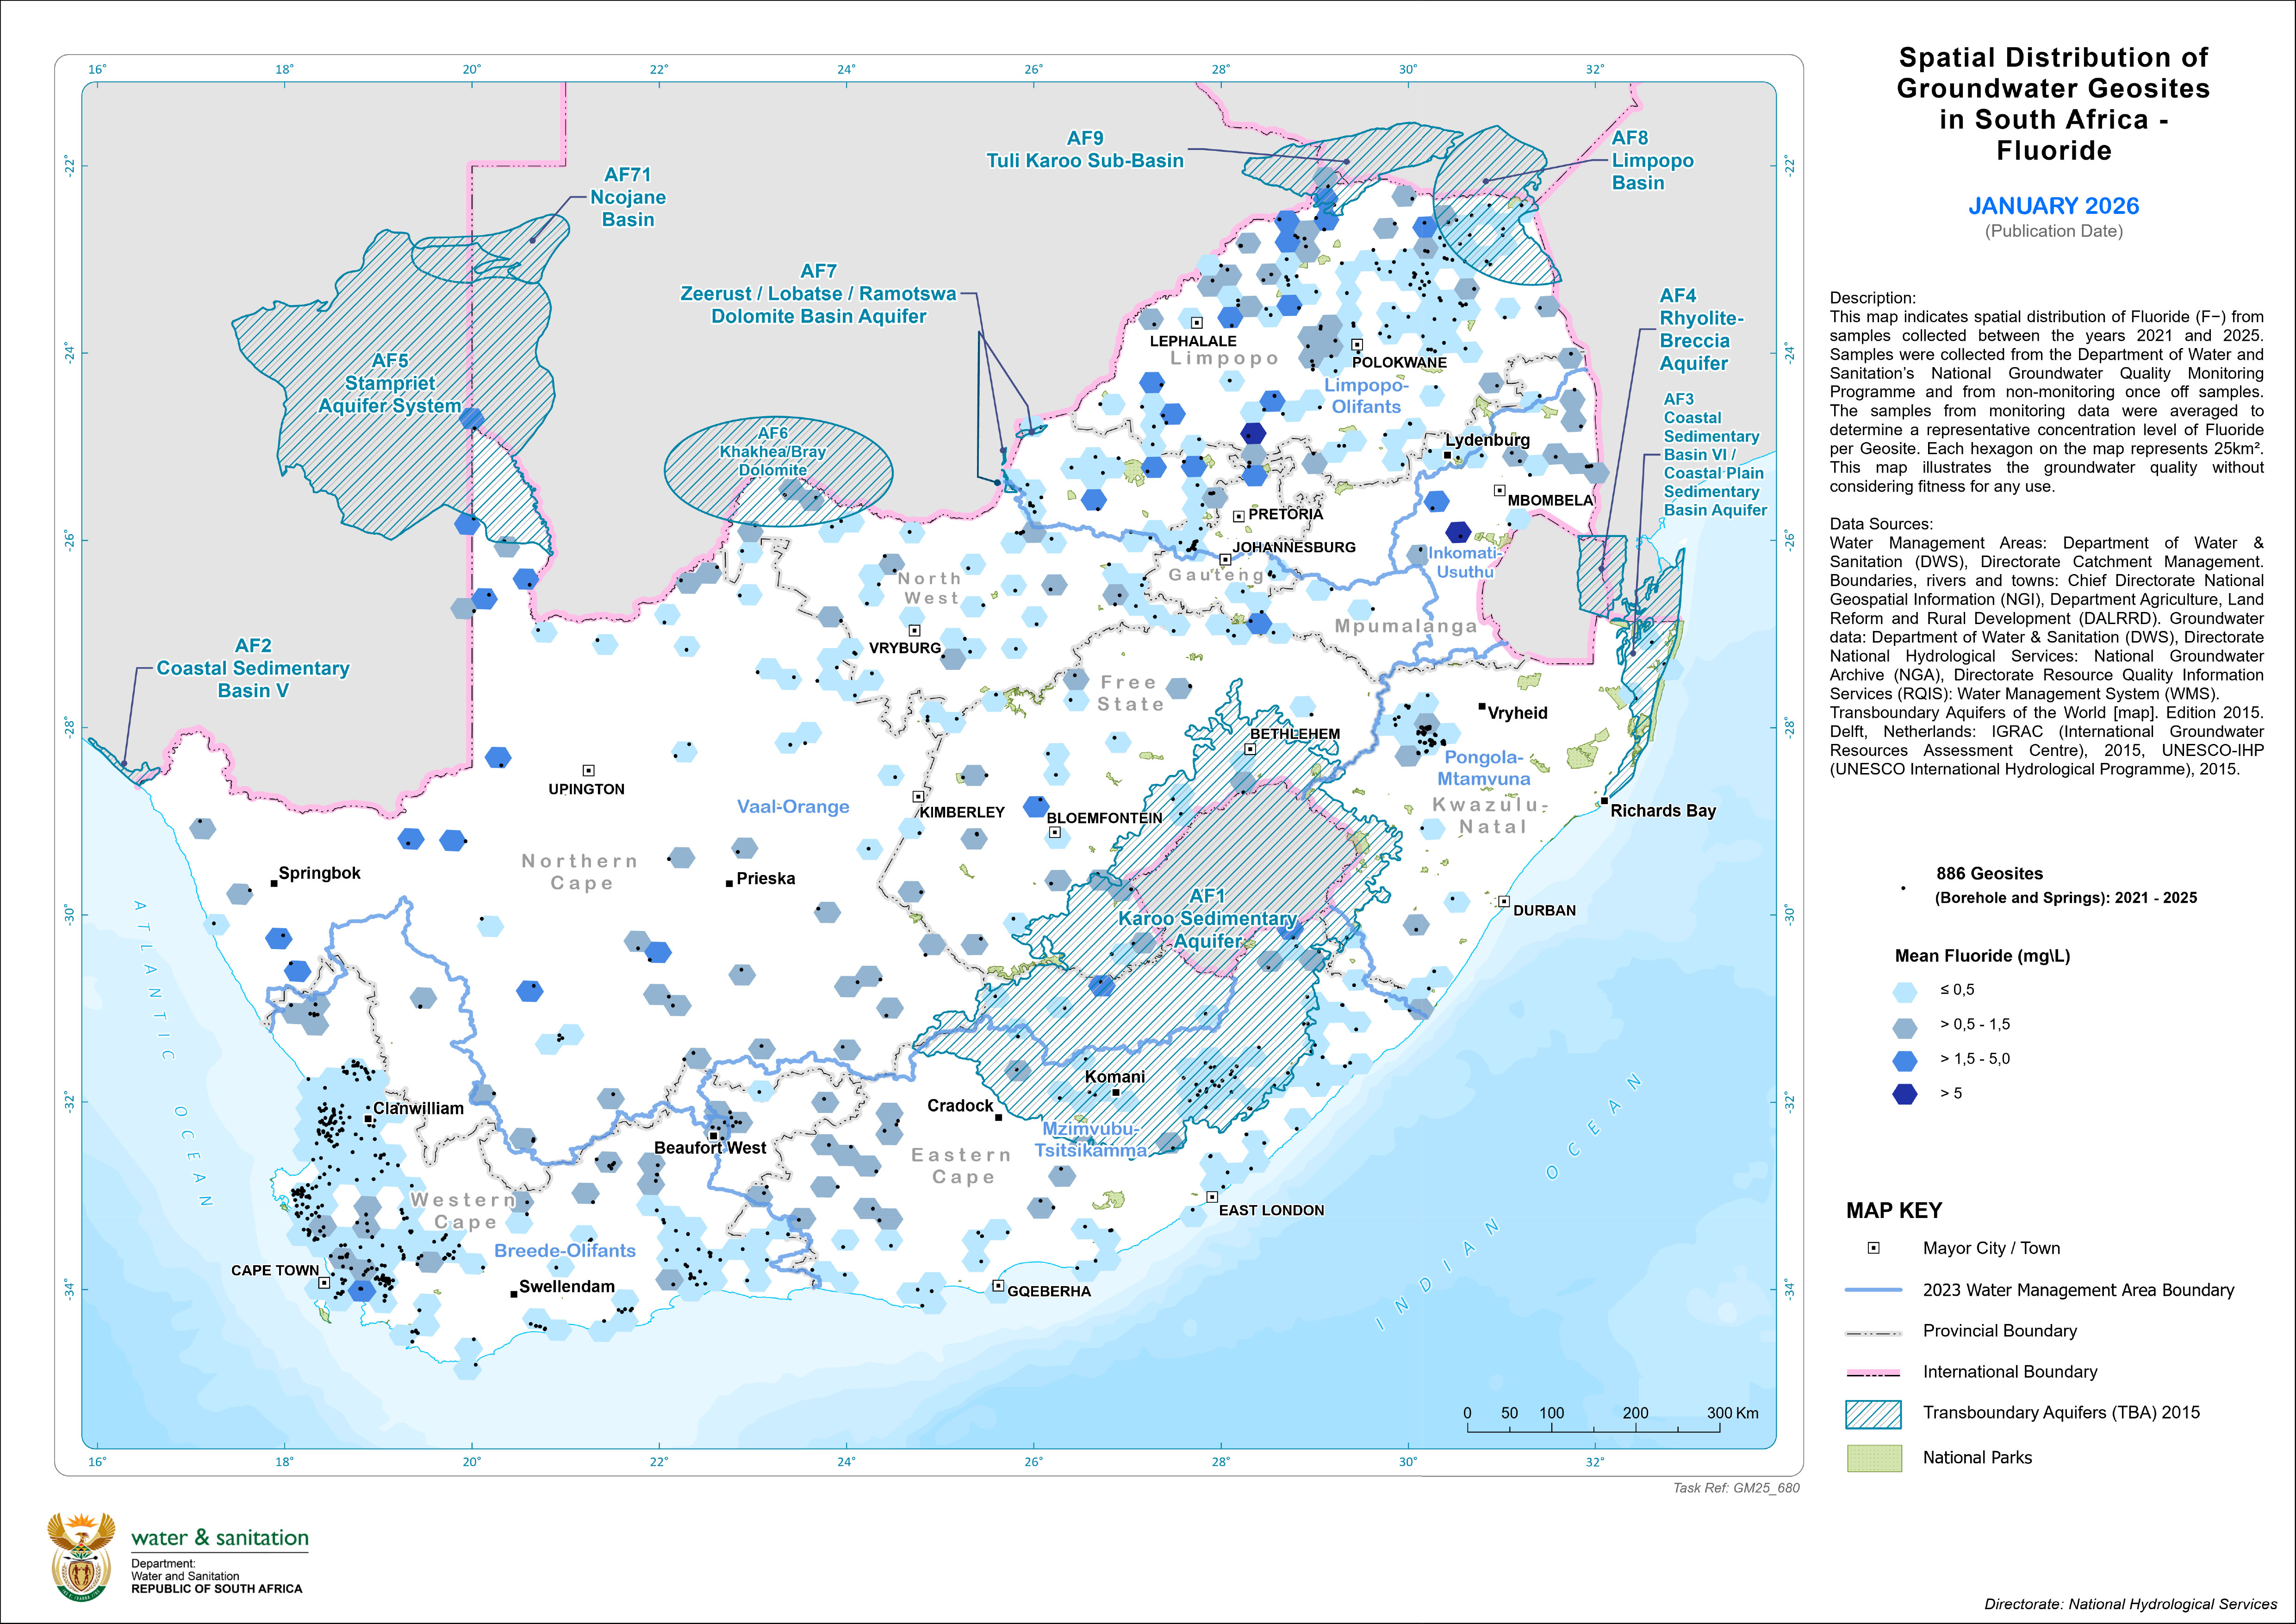
This map illustrates the spatial distribution of Fluoride (F−) from samples collected from Geosites between the years 2021 and 2025. Samples were collected from the Department of Water and Sanitation’s National Groundwater Quality Monitoring Programme and from non-monitoring once off samples. The samples from monitoring data were averaged to determine a representative concentration level of Fluoride per Geosite. Each hexagon on the map represents 25km². This map depicts the groundwater quality without considering fitness for any use.
|